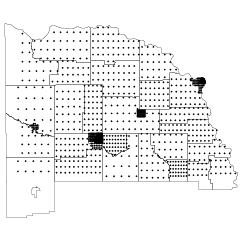
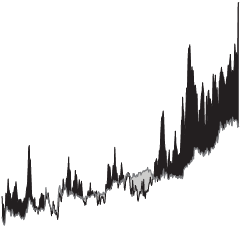
 The Internet has made it easier to donate to presidential campaigns, so much so that the Federal Election Commission has had a hard time keeping up with the seemingly sudden influx of data they have to process.
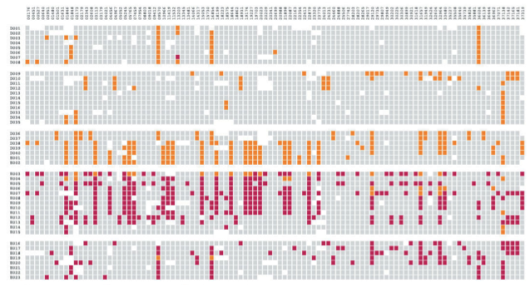
The campaign finance reports filed by Obama and Clinton have grown so massive that they’ve strained the capacity of the Federal Election Commission, good government groups, the media and even software applications to process and make sense of the data.
Hold up. Even computers are buckling under the pressure? The first things that came to mind were crashing servers and tech maintenance pulling their graying hair out. Reading on though, “software” is a reference to Microsoft Excel 2003, which can’t handle data files larger than 65,536 rows or 256 columns.
Phew, that was close. I mean, come on, this is nation-wide data. Give me a MySQL dump for Pete’s sake.
Anyways, tt’s certainly a good indicator for how times have changed data-wise. Excel 2007 can handle more. And on that note – it’s still possible to open John McCain’s monthly reports in Excel 2003.
[Thanks, David]
 Mobile technology has come a long way from those foot-long phones hooked up to a shoe box sized battery pack. With bluetooth, GPS, cameras, and Internet connections, mobile phones nowadays pack a lot of power. How can we put this functionality to use?



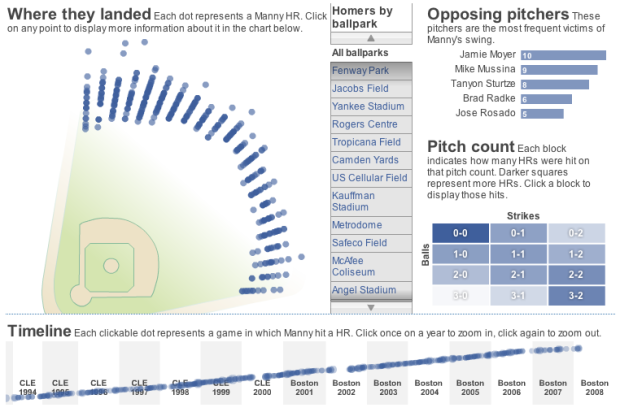

 The more people who flock a story, the higher up the flock list the story goes. In the sidebar of each story is an interactive graphic that shows readers flocking around the news and stories getting highlighted. The larger the bubble, the more people who have flocked it; story bubbles light up orange when someone flocks it. The site isn’t showing any larger sizes, but a full screen version could be fun. Maybe a screensaver.

 Visualize This: The FlowingData Guide to Design, Visualization, and Statistics (2nd Edition)