As the newest release from Google Labs, Fusion Tables is a tool that aims to make your data more accessible.
Today we’re introducing Google Fusion Tables on Labs, an experimental system for data management in the cloud. It draws on the expertise of folks within Google Research who have been studying collaboration, data integration, and user requirements from a variety of domains. Fusion Tables is not a traditional database system focusing on complicated SQL queries and transaction processing. Instead, the focus is on fusing data management and collaboration: merging multiple data sources, discussion of the data, querying, visualization, and Web publishing.
Google Spreadsheets + phpMyAdmin
Fusion Tables will feel familiar to those of you who use Google Spreadsheets, but the use is somewhat different.
Where Spreadsheets is meant to mimic much of the feel of MIcrosoft Excel, Fusion Tables is somewhere in the middle between Excel and database (or at least it hopes to be eventually). You can filter data as well as merge your datasets with others, for example, by country.
Maybe the best way to describe Fusion Tables is a cross between Google Docs and phpMyAdmin, which is a user interface into a MySQL database.
Visualization Options
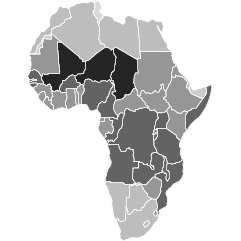
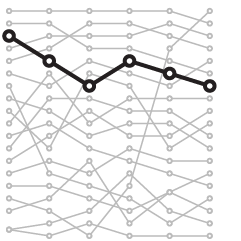
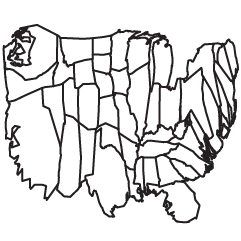
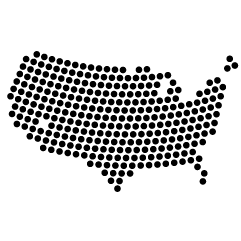
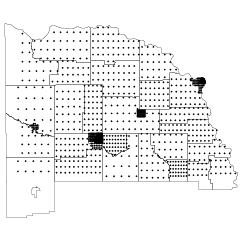
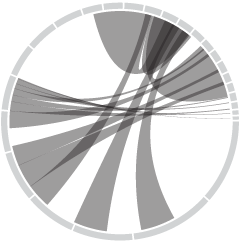
Probably of most interest are the visualization options. They’re what you’re used to seeing with line, pie, and bars, all looking very Google-y. The new ones to check out: motion chart and intensity map (above). There’s also a regular point mapping option. Again, we’ve seen these visualizations before, but Fusion Tables is trying to make it easier to use them.
What do you think of Google’s new offering? GIve it a whirl with their sample tables, and come back here and let us know what you think in the comments below.
[Thanks Andrew, NoodleGei, Oleks, and everyone else…]

 There’s a lot of crime data. For almost every reported crime, there’s a paper or digital record of it somewhere, which means hundreds of thousands of data points – number of thefts, break-ins, assaults, and homicides as well as where and when the incidents occurred.
 will recognize the discussion.

 . Get your entry in by July 1. One entry per person.
 Are you an information designer looking for a project?
 Do you have some data on your hands and don’t know what to do with it? Are you wondering what the best way to graph a dataset might be? Want some input on stuff you made?
 Visualize This: The FlowingData Guide to Design, Visualization, and Statistics (2nd Edition)