• Membership
  • Newsletter
  • Projects
  • Learning
  • About
  • Member Login
  • The future of maps isn’t maps →

    July 12, 2012

    Topic

    Maps

    Rebecca Rosen for The Atlantic on why maps aren’t the best interface all of the time:

    Think of it this way. In the days before online trip planners and GPS, if you wanted to know how to get from point A to point B, you would look at a map and trace out a route. But these days few people would use a map that way (I still do just because I enjoy the process but I think I’m in the minority). Instead, they would plug in their request and an algorithm would spit out a route for them. The route would appear on the map, but the map is no longer the tool for finding that answer.

    In other words, just because the data has latitude and longitude attached to it, which seems like everything these days, you don’t need to automatically assume that you should throw it on a map.

  • Map of the underwater Internet →

    July 11, 2012

    Topic

    Maps  /  Internet

    Nicolas Rapp, for Fortune Magazine, mapped the underwater cables that make the global Internet possible.

    If the internet is a global phenomenon, it’s because there are fiber-optic cables underneath the ocean. Light goes in on one shore and comes out the other, making these tubes the fundamental conduit of information throughout the global village. To make the light travel enormous distances, thousands of volts of electricity are sent through the cable’s copper sleeve to power repeaters, each the size and roughly the shape of a 600-pound bluefin tuna.

  • Where you measure up against Olympians →

    July 11, 2012

    Topic

    Statistical Visualization  /  BBC, interactive, Olympics

    I think the theme of this year’s Olympic graphics is how you relate to athletes. In this interactive by the BBC (in Spanish), height and weight of medal winners from the last Olympics in Beijing are plotted against each other. The more red, the more athletes with that weight-height combination, and you can click on a square to see the corresponding athlete(s). The twist is that you can enter your own height and weight to see where you are in the mix.

    Combine this with the recent age piece from the Washington Post, and you’ve got a more complete picture. Why stop there though? I want country, gender, and hair color breakdowns. [Thanks, Ben]

  • Sonification of Stanley Cup goals →

    July 10, 2012

    Topic

    Data Art  /  hockey, sonification, Stanley Cup

    Artist Bard Edlund sonified the goals during the 2012 Stanley Cup.

    The goals tally cumulative scoring for each team (rather than goals against). When a puck crosses the goal line, a musical note plays. There’s one instrument sound for Western Conference teams, and another for Eastern Conference teams. Higher-seeded teams are assigned a higher pitch. This means you can actually hear whether higher- or lower-seeded teams are scoring more, and if Western or Eastern Conference teams are producing more goals.

    The beat in the background almost makes it sound like an actual song.

  • Soda versus pop on Twitter →

    July 9, 2012

    Topic

    Statistics  /  soda, Twitter

    Edwin Chen, a data scientist at Twitter, explored the geographic differences in language usage of soda, pop, and coke. We’ve seen this before, so it shouldn’t be surprising to see that in the United States soda is dominant on the coasts, pop in the midwest, and coke in the southeast. The global view is new, with coke basically penetrating almost all of Europe.

    What I think is most interesting though is the idea of tweets and status updates as data that represents cultures. There are applications that keep track of tweet volume, number of replies, and when the best time to share a link is, but in ten years none of that will matter. These miniature data time capsules on the other hand will be worth another look.

  • Evolution of the Formula One car, animated

    July 9, 2012

    Topic

    Infographics  /  animation, racecar

    Animator and illustrator Rufus Blacklock animated 60 years of Formula One race car design. The outline of each year’s car morphs from design to design, the engine shifts location, and the steering wheel changes shape. The video as a whole is pretty sexy.

    He also took a look at just the steering wheel’s evolution. I’m almost certain the next iteration will be non-existent in the future, where only robots race. Speaking of which, whatever happened to Robot Wars? That was good entertainment.

    [via Revolutions]

  • Mitt Romney pseudo-venn diagram, used incorrectly

    July 8, 2012

    Topic

    Mistaken Data  /  Mitt Romney, venn diagram

    The Mitt Romney campaign put this venn diagram up a few days ago, aiming to show the “promise gap.” On the left is an Obama promise, and on the right is the result. In the middle, the combination of the promise and the result, is the gap. Wait, that’s not right.

  • A year of global cloud coverage →

    July 6, 2012

    Topic

    Maps  /  animation, environment, New York Times

    Jonathan Corum for the New York Times mapped cloud coverage from April 2011 to April 2012.

    At any moment, about 60 percent of the earth is covered by clouds, which have a huge influence on the climate. An animated map showing a year of cloud cover suggests the outlines of continents because land and ocean features influence cloud patterns.

    So if I’m understanding it right, the continent boundaries come straight from the cloud data, provided by NASA Earth Observations. No lines are drawn underneath, which is kinda awesome. [via @datapointed]

  • Page 269 of 392
  • <
  • 1
  • ...
  • 266
  • 267
  • 268
  • 269
  • 270
  • 271
  • ...
  • 392
  • >

Analyze, visualize, and communicate data usefully, beyond the defaults.

Become a member →

Recently for Members

May 8, 2025
When the data is not what it seems

May 1, 2025
Finding the Right Charts

April 24, 2025
Visualization Tools, Datasets, and Resources – April 2025 Roundup

April 17, 2025
Breaking Out of Chart Software Defaults

April 15, 2025
Line Chart with Decorative Neon Accents

Browse by Chart Type See All →

Spiral Chart Timeline Radar Chart Bump Chart Bubble Chart Moving Bubbles Calendar Cartogram Network Graph Area Chart

Browse By Topic

  • Visualization

    Seeing data

  • Maps

    Seeing geographic data

  • Infographics

    Explaining data

  • Networks

    Connecting data

  • Statistics

    Analyzing data

  • Software

    Working with data

  • Sources

    Getting data

  • Design

    Making data readable

Get the Book

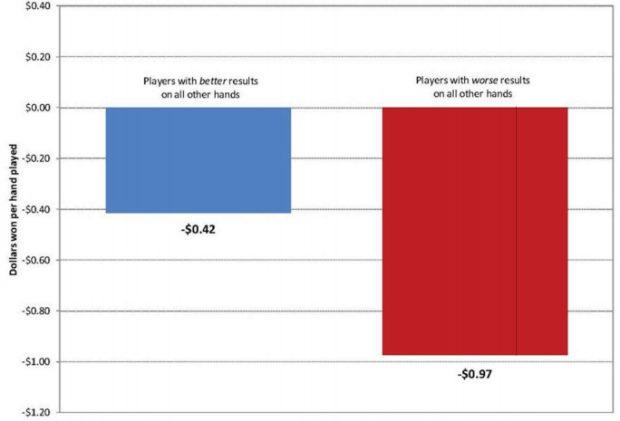
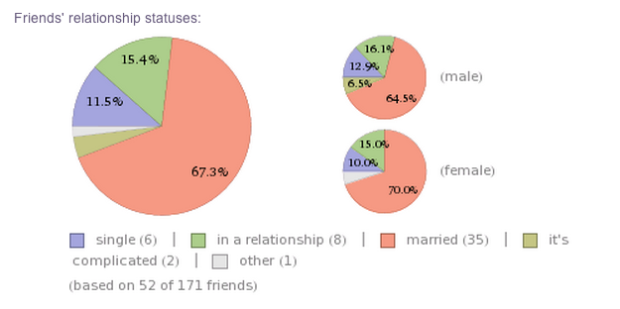
Visualize This: The FlowingData Guide to Design, Visualization, and Statistics

Available now.

Order: Amazon / Bookshop

Made by FlowingData

  • The Process

  • Data Underload

  • Chart Everything

  • Guides

  • Books

  • Shop

  • About
  • Contact
  • Newsletter
  • LinkedIn
  • Instagram
  • Bluesky
  • RSS
Copyright © 2007-Present FlowingData. All rights reserved.