 In parts of the world where there are few smartphones and GPS-enabled devices, transportation architecture has to be designed based on less granular resources, such as surveys, which can result in rough estimates. IBM researchers are looking into how data from simple cell phones can be used instead to see how people move.
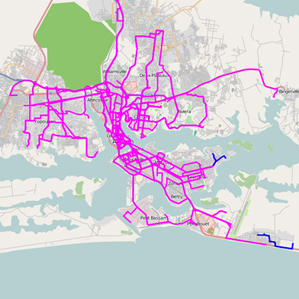
The IBM work centered on Abidjan, where 539 large buses are supplemented by 5,000 mini-buses and 11,000 shared taxis. The IBM researchers studied call records from about 500,000 phones with data relevant to the commuting question…
While the data is rough—and of course not everyone on a bus has a phone or is using it—routes can be gleaned by noting the sequence of connections. And IBM and other groups have found that these mobile phone “traces” are accurate enough to serve as a guide to larger population movements for applications such as epidemiology and transportation.
[via @krees]
 Ben Orlin likes math and teaching. He’s bad at drawing. He has a blog on


 Visualize This: The FlowingData Guide to Design, Visualization, and Statistics (2nd Edition)


