Beeswarm
It emphasizes individual points in a distribution instead of binning them like a histogram.
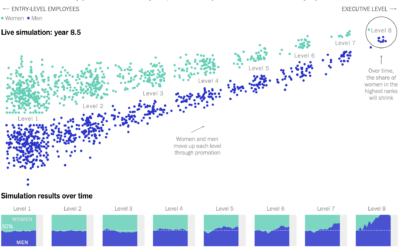
Simulating how just a little gender bias in the workplace can lead to big effects up the chain
Yuhao Du, Jessica Nordell, and Kenneth Joseph used simulations to study the effects…
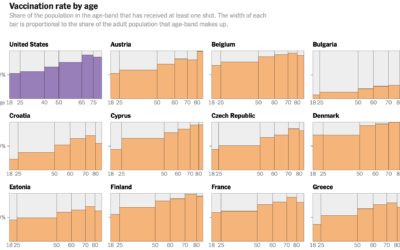
Decline of U.S. vaccination rate compared against Europe’s
Elian Peltier and Josh Holder for The New York Times highlight the vaccination…
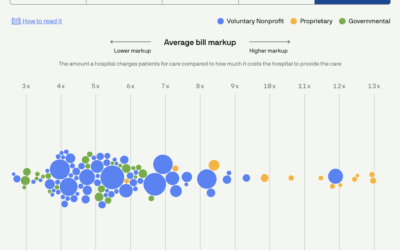
Scoring hospitals by billing quality
Using data collected by Johns Hopkins University, Michelle McGhee and Will Chase for…
Population Growth and Seats Gained
The Census Bureau released state population counts for 2020. Here's how each state gained and lost population and seats.
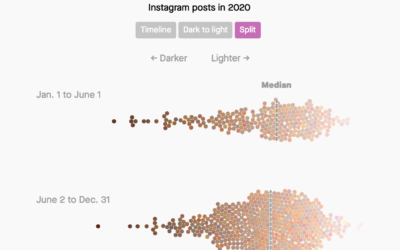
Analysis of skin tones in beauty ads on Instagram
For Quartz, Amanda Shendruk and Marc Bain analyzed skin tones that appeared in…
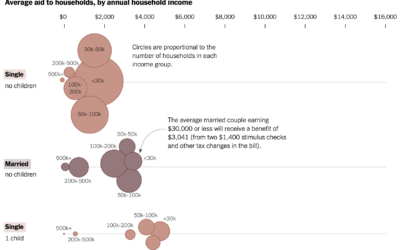
Average stimulus aid, by household size and income
Alicia Parlapiano and Josh Katz, reporting for NYT’s The Upshot, plotted the average…
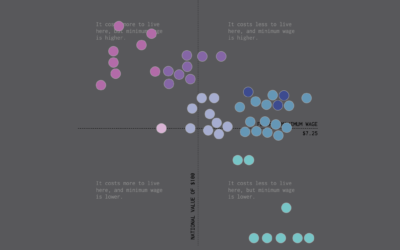
Minimum Wage and Cost of Living
We already looked at minimum wage over time, but when it comes to geography and income, you also have to consider the cost of living for a fair comparison.

How Much Minimum Wage Changed in Each State
Minimum wage has increased over the years, but by how much depends on where you live.
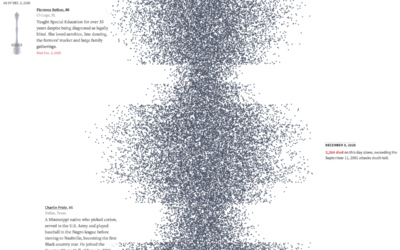
500,000 lives lost, an individual scale
The United States passed the half million mark for confirmed Covid-19 deaths. It’s…
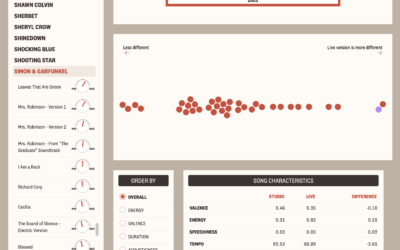
Comparing live music recordings against the studio versions
There’s something about hearing music live no matter how many times you’ve heard…
How to Make an Animated Beeswarm Chart
Beeswarm charts are useful to highlight individual categories or entities. Animating them can help highlight change over time.
Unemployment and Occupation
Unemployment has hit some industries more than others. Here's how the most recent estimates compare against last year's.
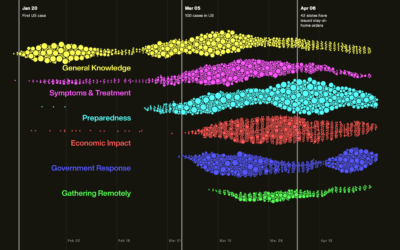
Search trends during the pandemic
As you would imagine, what we search for online shifted over the past…
Salary and Occupation, in 2018
Salaries vary across occupations. Here are some charts that show by how much for 800 of them.
Differences Between Women and Men’s Everyday with Kids
The day-to-day changes a lot when you have kids. However, it seems to change more for women than it does for men.
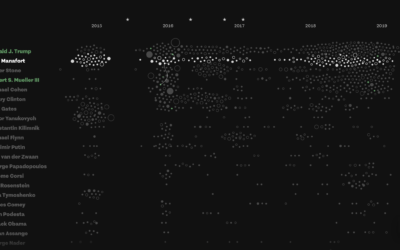
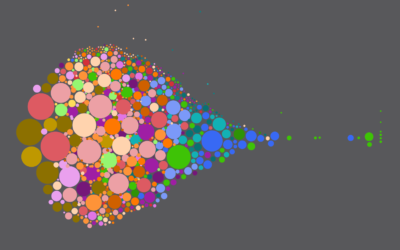
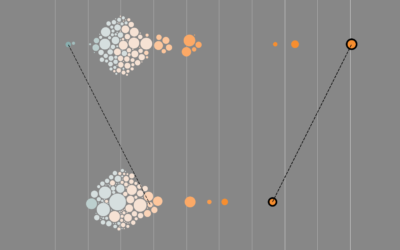
Connections and patterns in the Mueller investigation
While we’re on the subject of distributions, Fathom used a collection of beeswarm…
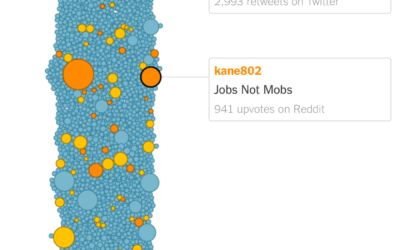
How a meme grew into a campaign slogan
A meme that cried “jobs not mobs” began modestly, but a couple of…
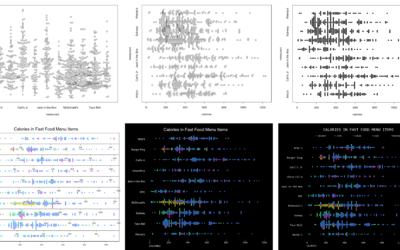
How to Make Better-Looking, More Readable Charts in R
Defaults are generalized settings to work with many datasets. This is fine for analysis, but data graphics for presentation benefit from context-specific design.
Remote Workers vs. Non-Remote Workers
How the schedules between remote and non-remote workers differ during workdays.
A visualization game to understand education and school segregation
Educate Your Child by Gabrielle LaMarr LeMee uses census data and the school…