How Much the Everyday Changes When You Have Kids
Before I had kids, I knew life would be different, but I wasn’t prepared for just how different the everyday would be. It turns out that taking care of kids requires a lot of attention and time, and that extra time must come from somewhere.
Coming back to my old data friend, the American Time Use Survey, I compared time use for those with children under 18 of their own in the household against those without.
More specifically, I plotted the 25th to 75th percentile range for both groups and the medians for reference. I looked at non-holiday weekdays.
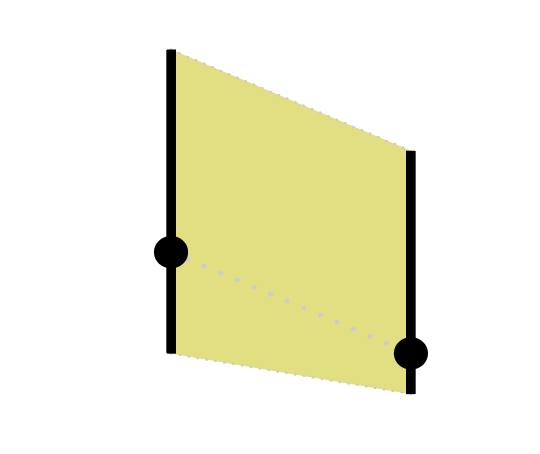
Here’s how to read the charts below:

Does not have own
kids under 18
in household
Has own
kids under
18 in
household
20
75th
percentile
15
Minutes
in day
10
Median
5
25th
percentile
Compared median to those with no kids
-40%
-20%
-10%
10%
20%
40%
Less time
More time
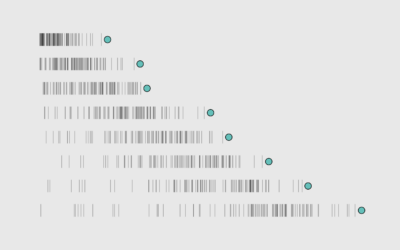
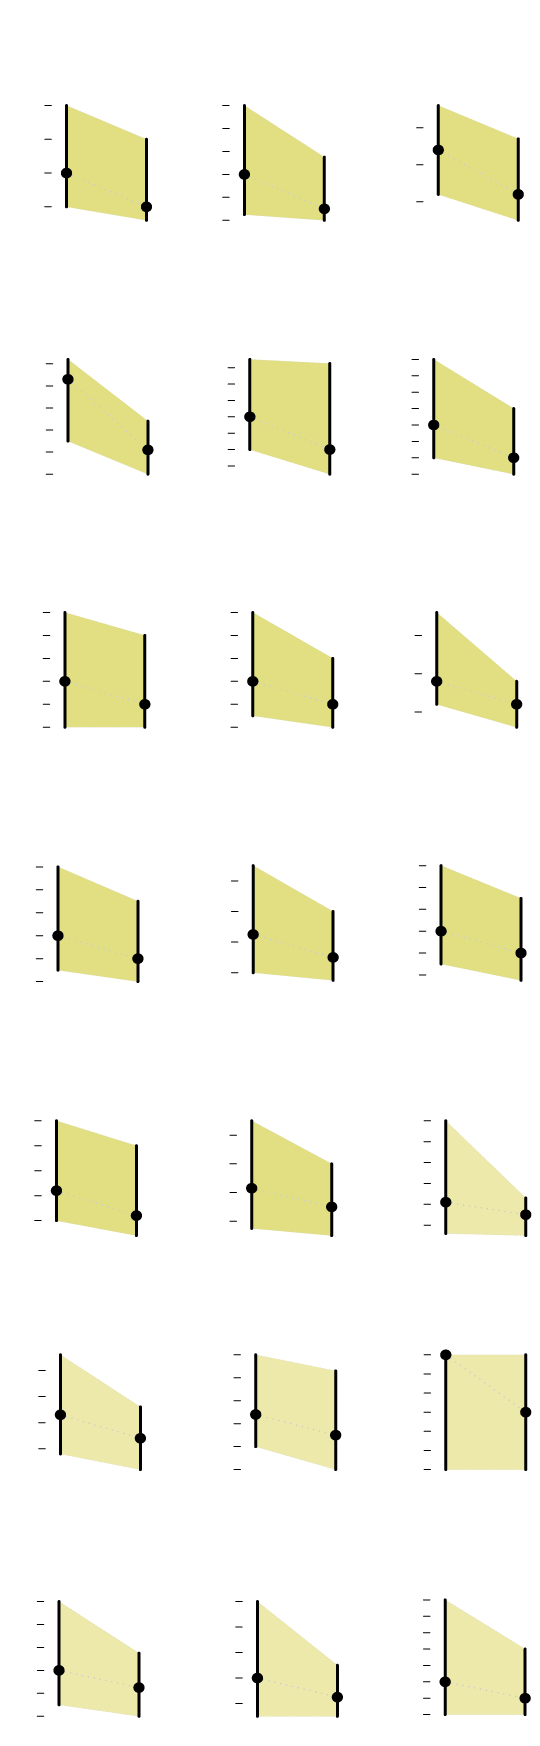
Out of 605 classified activities, below are the ones that showed the biggest drops for no-kids to kids. Relaxation, playing games, phone calls, and other personal activities take the biggest hit.

Personal
Relaxing,
thinking
Arts and
crafts
Taking
class
Playing w/
non-household
children
Personal
e−mail and
messages
Vehicle
repair
Phone calls,
misc.
Playing
games
Phone calls
w/ friends
No Kids
Kids
No Kids
Kids
No Kids
Kids
No Kids
Kids
No Kids
Kids
No Kids
Kids
No Kids
Kids
No Kids
Kids
No Kids
Kids
No Kids
Kids
20
120
45
120
60
60
400
160
Minutes
40
150
100
100
50
150
50
140
350
35
15
120
80
80
40
40
300
30
100
100
100
25
10
60
60
30
30
250
80
20
60
40
40
20
20
200
50
15
50
5
40
20
150
10
20
10
10
Listening
to radio
Looking after
hh children
(primary act)
Tobacco &
drug use
Repair,
maintenance
Care for
hh adults
TV and
movies
Religious
practices
Homework (hh
children)
Computer
use for
leisure
Reading
No Kids
Kids
120
30
60
60
60
120
120
80
80
250
55
50
100
50
100
25
100
Minutes
50
40
200
60
80
60
40
80
20
80
45
30
60
150
30
60
40
15
40
40
60
20
40
20
40
100
35
10
20
40
10
20
20
10
30
20
Missing
travel or
dest.
Not enough
detail
Listening to/
playing music
(not radio)
Sewing
Work,
other job(s)
Planning for
hh children
Laundry
Running
Waiting
for medical
services
Travel for
shopping
No Kids
Kids
200
45
120
120
90
60
45
40
300
Minutes
40
80
40
40
55
35
100
100
250
150
35
70
35
50
30
30
80
30
60
30
80
200
45
25
25
50
25
100
60
20
150
60
40
20
20
40
20
35
40
100
15
30
15
15
50
10
40
10
20
30
10
10
50
Travel for
excercise
Travel for
gas
Travel for
nonhh kids
Interior
decoration
Shopping
Gap/can’t
remember
Driving nonhh
children
Phone calls
w/ family
Attending hh
children’s
events
No Kids
Kids
30
30
40
80
12
45
120
100
200
Minutes
40
70
35
110
25
10
25
35
60
30
80
100
150
20
8
30
50
20
25
90
25
15
60
6
40
100
20
80
20
15
30
10
4
15
70
15
40
50
20
10
5
10
2
10
60
Personal
Arts and
crafts
Relaxing,
thinking
No Kids
Kids
No Kids
Kids
No Kids
Kids
20
120
Minutes
150
100
15
80
100
10
60
40
50
5
20
Personal
e−mail and
messages
Taking
class
Playing w/
non-hh
children
No Kids
Kids
45
400
160
40
140
350
35
120
300
30
100
25
250
80
20
60
200
15
40
150
10
Vehicle
repair
Phone calls,
misc.
Playing
games
No Kids
Kids
120
60
100
50
150
80
40
100
60
30
40
20
50
20
10
Phone calls
w/ friends
Care for
hh children
(primary)
Listening
to radio
No Kids
Kids
120
60
80
Minutes
100
50
80
60
40
60
30
40
40
20
20
20
10
Tobacco &
drug use
Repair,
maintenance
Care for
hh adults
No Kids
Kids
30
60
80
50
25
40
60
20
30
40
15
20
10
20
10
TV & movies
Religious
practices
Homework
No Kids
Kids
60
60
250
55
50
50
200
40
45
150
30
40
20
100
35
10
30
Computer for
leisure
Reading
Missing
travel or
dest.
No Kids
Kids
45
120
120
40
100
100
35
80
30
80
25
60
60
20
40
15
40
10
20
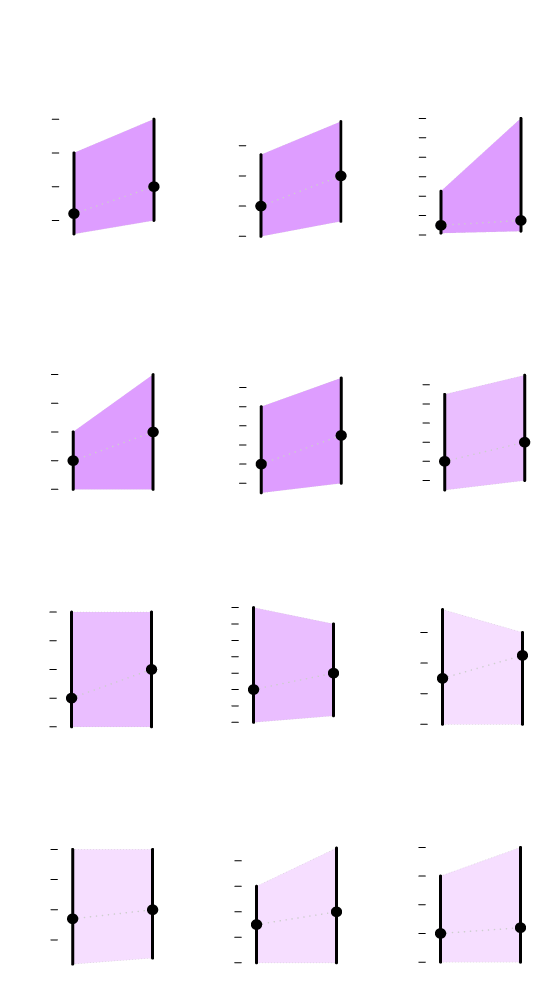
Where do all of the minutes go? Mostly shuttling around kids, taking care of kids, and preparing to take care of kids.

Health−related
self care
Food
presentation
Pick-up/
drop-off hh
children
Care for
hh children
Travel for
hh children
Food
preparation
No Kids
Kids
No Kids
Kids
No Kids
Kids
No Kids
Kids
No Kids
Kids
No Kids
Kids
120
25
20
70
70
100
Minutes
40
20
60
60
15
80
50
50
30
15
60
40
10
40
40
10
30
20
30
20
5
20
20
5
0
10
Grocery
shopping
Travel for
class
Travel for
nonhh adults
Religious
services
Travel for
banking
Working out,
misc.
No Kids
Kids
25
50
50
60
70
45
Minutes
120
20
40
40
50
60
35
100
15
30
40
50
30
25
10
80
40
30
20
20
5
15
30
60
20
Health−related
self care
Pick-up/
drop-off hh
children
Travel for
hh children
No Kids
Kids
No Kids
Kids
No Kids
Kids
120
20
100
Minutes
40
15
80
30
60
10
40
20
20
5
0
10
Food
presentation
Care for
hh children
Food
preparation
No Kids
Kids
25
70
70
Minutes
20
60
60
50
50
15
40
40
10
30
30
20
20
5
Grocery
shopping
Travel for
class
Religious
services
No Kids
Kids
50
60
45
Minutes
120
40
50
35
100
40
30
25
80
30
20
15
60
20
Travel for
nonhh adults
Travel for
banking
Working out,
misc.
No Kids
Kids
25
50
70
Minutes
20
40
60
15
30
50
10
40
20
5
30
Good times.
All of the changes seem to make sense, but I’m a little surprised that “working out” inched up for those with kids. That has not been my experience. I wonder if we’re seeing parents who work from home or are stay-at-home drop off their kids at school and then head to the gym. That seems to make sense anecdotally. I’ll have to take a look at that subset.
Notes
- The data comes from five years of American Time Use Survey data, from 2013 through 2017. I downloaded the data via IPUMS, which is tops.
- I made the charts in R.
Chart Types Used


Become a member. Support an independent site. Get extra visualization goodness.
See What You Get