Visualization
Showing the stories in data through statistics, design, aesthetics, and code.

Cyanotype to represent grief
Marking the third anniversary of the first Covid deaths in the United States,…
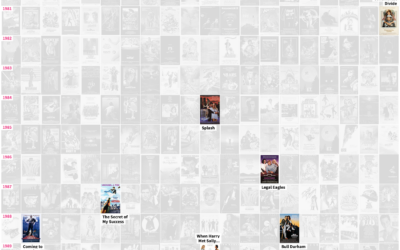
Tour of romantic comedies through the decades
In celebration of the most romantic day of the year that is sometimes…
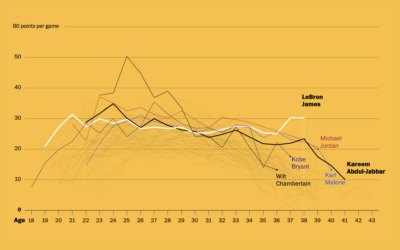
LeBron James’ longevity
Okay, one more LeBron James thing, mostly because I like seeing different looks…

Search and rescue after an earthquake, illustrated
After a big earthquake, such as the 7.8 that hit Turkey and Syria,…
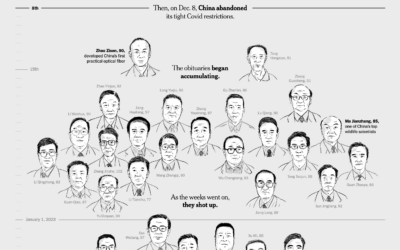
Inferring the scale of China’s Covid spike through obituaries
China reported 80,000 Covid deaths since lifting restrictions in early December 2022. But…
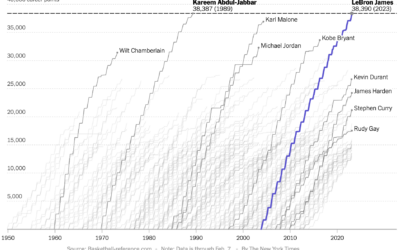
Cumulative points scored by LeBron James and other top scorers
Never fear, Sopan Deb, K.K. Rebecca Lai, and Eve Washington, for The New…

All of LeBron James’ career points, animated by season
All The King’s Buckets. pic.twitter.com/lzIultYSee
— Kirk Goldsberry (@kirkgoldsberry) February 8, 2023
LeBron…
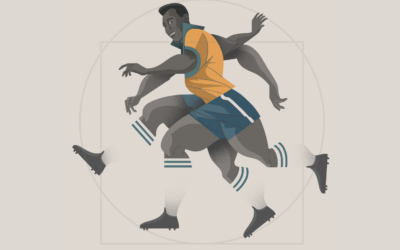
Pele greatness illustrated
For South China Morning Post, Victor Sanjinez and Dennis Wong used a visual…
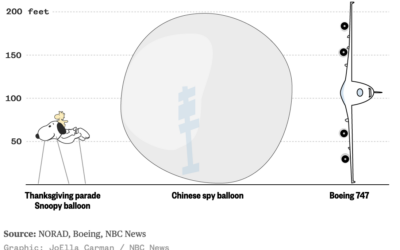
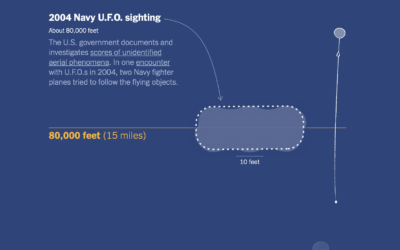
Scale of the Chinese balloon
I wasn’t paying much attention to the Chinese balloon that the U.S. shot…

Objects in space headed towards Earth
NASA’s Center for Near Earth Object Studies tracks large objects, such as asteroids,…

Wonders of Google Street View
You know those funny or weird screenshots from Google Street View that enter…
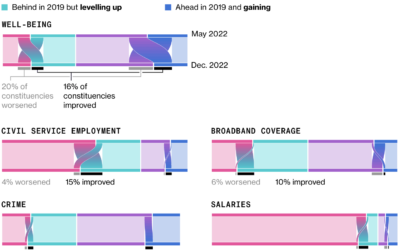
Sankey diagrams to show change in opinion
For Bloomberg, Joe Mayes, Andre Tartar, and Demetrios Pogkas show shifts in public…
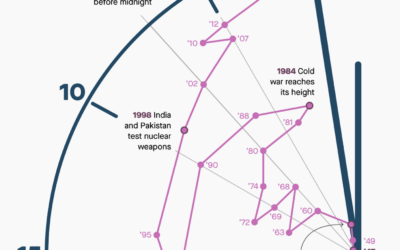
Shifts in time on the Doomsday Clock
The Doomsday Clock is a metaphorical clock that symbolizes a catastrophic end to…
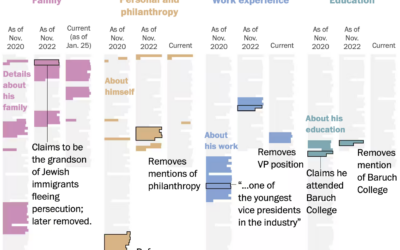
Evolution of George Santos’ biography
George Santos, currently a U.S. representative, seems to lie about his background and…
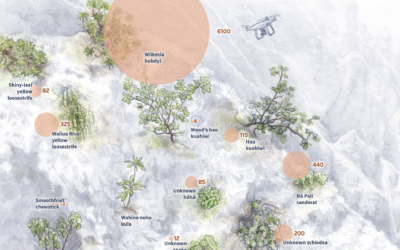
Battling plant extinction
In a story about how scientists are using drones to fight plant extinction,…

Differing approaches between SpaceX and NASA to sending rockets to the moon
For The Washington Post, William Neff, Aaron Steckelberg, and Christian Davenport show the…