Projects
Graphics by Nathan Yau, borne out of everyday curiosities, learning experiments, and mild insomnia.
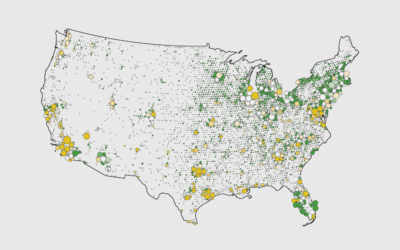
McDonald’s Locations vs. Golf Courses
There are thousands of McDonald's locations, but there are still more golf courses in the United States. This seems surprising, but some maps make it clear.
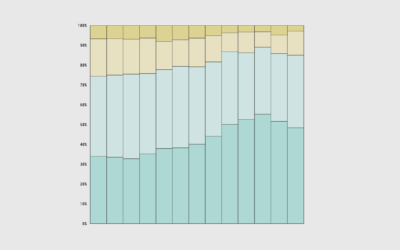
Feeling Rested with Age
How much you sleep each night matters, but more importantly, it's about the quality and if you feel rested when you wake up.
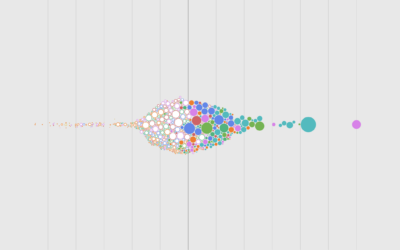
Race and Occupation
Asian workers are more than three times more likely to be physicians. What other jobs jump out? What's it like for other races and ethnicity?
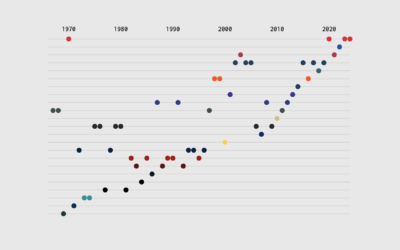
When and How Many Super Bowl Wins, by Team
How does the modern Kansas City Chiefs compare to teams who won previous Super Bowls over the past 58 years?
Highest Education Level and Age Distributions
Education paths start to diverge towards the end of high school and after.
Commonness of Races in Different Occupations
Some occupations are more race-dominant than others. This is the percentage of employed persons 16 years and older who are a given race or ethnicity for each.
Young Money
We often associate high income with older people, but young people can also earn higher incomes. Let's see what those people studied and what they do for a living.
Jobs with Higher Income and Fewer Hours
So people earn a six-figure income without working all the time. What do they do?
Most Common Jobs, by Income Group
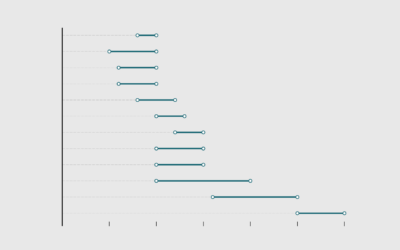
These are income ranges for the ten most common jobs at different income levels.
Rising to Top Net Worth, by Age
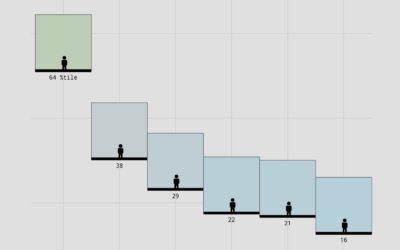
With the most recent release from the Survey of Consumer Finances, see how your household's net worth compares against others'.
Most Common Causes of Death, by Age
This is how the most common causes have changed over time for people aged 0 to 85.
Scale of Sports Fields and Courts
Here are the major sports drawn at the same scale to help appreciate the differences between field and court sizes.
How Cause of Death Shifted with Age and Time in America
As we get older, our life expectancy declines. But when and how quickly the decline happens and how it happens has changed over the years.
Life Expectancy of Pets
When looking into getting a pet, it’s important to consider life expectancy. You probably don’t want to accidentally sign up for a twenty-year commitment with an impulse adoption at the pet store.

