Just when you thought the path to lifelong happiness was uber simple and…
Nathan Yau
-

Path to happiness gets complicated and confusing
-
Federal CTO on government and data
Tim O’Reilly and Aneesh Chopra, Federal Chief Technology Officer sit down for a…
-
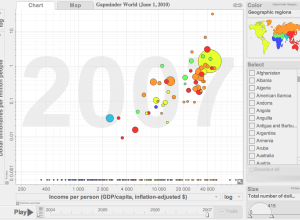
Gapminder makes its way to the desktop
You’ve seen the presentation. You’ve seen the motion graph tool. But up until…
-

How data travels from phone to computer
Time Warner Cable explains how a picture travels from Jeff’s phone to Vijay’s…
-
Best of FlowingData – June 2010
Thanks again, everyone for your retweets, likes, and stumbles. Every little bit helps…
-

Flowchart to lifelong happiness
The secret to lifelong happiness. If only it were so easy. [Typcut via…
-

Flowchart shows the startup business cycle
Technology and investment group HackFwd describes what it’s like to work with them…
-

Augmented reality taken to the extreme
Augmented reality, a computer trick to place the virtual within the real world,…
-
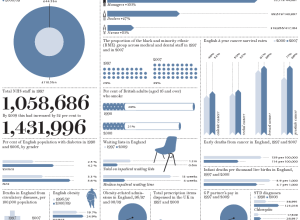
How Britain has changed since 1997
Prospect Magazine takes a look at how Britain has changed by the numbers…
-

Poyozo the personal data gatherer
Take a moment and think off all the data you put other there…
-

Stack Overflow for data geeks
I can’t count how many times I’ve googled a programming-related question and found…
-

JavaScript InfoVis Toolkit 2.0 released
Visualization in JavaScript is all the rage these days. Just a couple of…
-
Open data doesn’t empower communities
internet.artizans reflects on the usefulness of open data:
I’m inspired by the idea… -
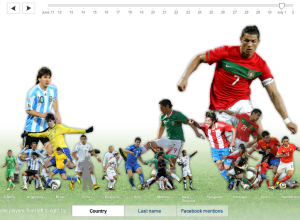
Top World Cup players on Facebook
I always know when something exciting happens in the World Cup when my…
-
Running on Thesis Fumes
I’m in the fifth year of my statistics PhD, and the time has…
-

Geography of Lost island
GIS guy Jonah Adkins maps the geography of Lost (the tv series). It…
-

Challenge: What is a FIFA player’s worth?
I really want to like this graphic on the “worth” of FIFA players.…
-

Mapping what your neighborhood used to look like
In part of their initiative to get young and old people to hang…
-
FlowingData is brought to you by…
My many thanks to the FlowingData sponsors who help keep the gears turning…
-
Who participates online, by age
Arno Ghelfi for Businessweek reports on who’s doing what online, separated by age.…
Recently for Members
Second Edition
 Visualize This: The FlowingData Guide to Design, Visualization, and Statistics (2nd Edition)
 Visualize This: The FlowingData Guide to Design, Visualization, and Statistics (2nd Edition)
New tools, refined process.
Browse by Chart Type See All →


