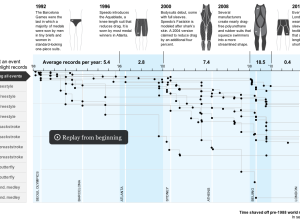
The Washington Post has a fine graphic on swimming world records and the…
Nathan Yau
-
Swimsuit technology and breaking world records
-
Link
How to visualise social structure →
Applying new techniques to old Census data
-
Link
Viral infographics and useful visual communication →
Stupid 10-second rule
-
Link
The Future of Big Data
Results from Pew survey on what to look forward to and what not to
-
Link
The Data Stack: A Structured Approach →
Layers of a data-driven application
-
Link
Data science: tools vs. craft →
Data science: tools vs. craft. It takes more than a program to do something useful.
-
From statistics to data science, and vice versa
Carnegie Mellon statistics professor Cosma Shalizi considers the differences and similarities between statistics…
-
Tracking the spread of AIDS →
Adam Cole and Nelson Hsu for NPR plotted the percentage of people, ages…
-
Great Lakes currents map
Using the same tech Martin Wattenberg and Fernanda Viegas created to show wind…
-
Link
Sometimes Less Really Is Less →
Reducing complexity
-
Link
Interview with Hilary Mason of bitly →
“I’m a firm believer in finding the smartest people you can, and letting them use whatever works best.”
-
Computing for data analysis
If you want to learn visualization, you should learn data. To learn data,…
-
Link
Infographics Are Not a Social Media Strategy →
Need something i.e. ideas or data for people to talk about
-
Link
You don’t need a real-time dashboard →
Technically impressive, but usually not useful for real decisions
-
Typographic superheroes
Designer Matthew Olin unmasked the characters behind the typeface characters for his MFA…
-
Life expectancy and child poverty as a tube map
Geographers James Cheshire and Oliver O’Brien visualized life expectancy in London as a…
-
Link
What Social Networks Know About You →
Graphic on the data that they have; probably would’ve been a lot easier to read as a grid instead of a circle
-
Link
Droughts on deadline →
Making a bunch of maps using maptools in R; actually really easy once you have the data
-
Link
Resistance to data →
Use it to verify your gut feelings
-
Link
Oil of the digital age →
Mobile tech advances; so do possibilities


 Visualize This: The FlowingData Guide to Design, Visualization, and Statistics (2nd Edition)


