Last time I looked at where major grocery stores are across the United…
Nathan Yau
-
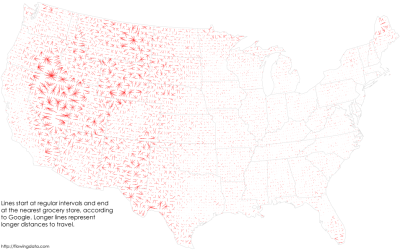
In search of food deserts
-
The inventor of modern probability
Andrei Kolmogorov is a name unfamiliar to most, but his work had lasting…
-
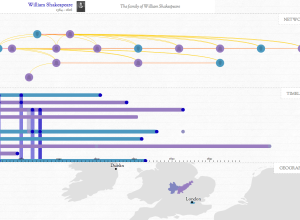
British relationships throughout history
In Kindred Britain, Nicholas Jenkins, Elijah Meeks and Scott Murray provide a visual…
-
A master’s degree in statistics is worthwhile
Statistician (and brand new PhD student) Jerzy Wieczorek explains the usefulness of a…
-
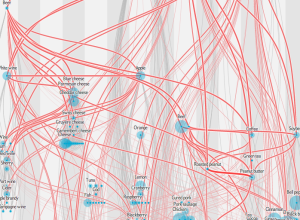
Network of shared flavors
Jan Willem Tulp, for this month’s Scientific American food issue, recreated the flavor…
-
Learn to make animated information graphics
Graham Roberts, a graphics and multimedia editor at The New York Times, is…
-
Pickle Index for population estimation
As China moves forward with a plan to move 250 million people to…
-
Introducing the FlowingData Job Board
If my inbox has taught me anything, it’s that there are a lot…
-
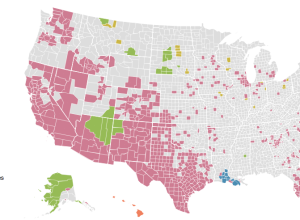
Where non-English language is spoken in the US →
Dan Keating and Darla Cameron for the Washington Post mapped commonly used languages…
-
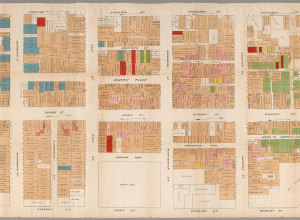
Map shows illegal activity in San Francisco Chinatown, from 1885
From the David Rumsey map collection, the detailed map of San Francisco Chinatown…
-
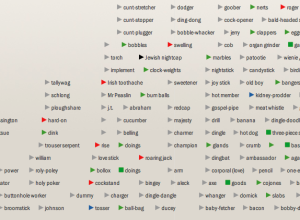
Extensive timelines of slang for genitalia
The title says it all. Jonathon Green, a slang lexicographer, has two new…
-
Why everyone is more popular than you
Mathematician Hannah Fry is back with another video. She explains why it seems…
-
Pie charts about pies with pies
Josh Sundquist and Hannah Hart made a video about pies, the edible variety…
-
Members Only
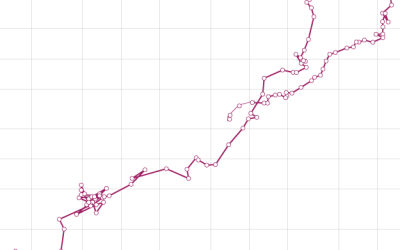
How to Make a Connected Scatter Plot
The combination of a time series chart and a scatter plot lets you compare two variables along with temporal changes.
-
Beach Boys vocals visualized
Alexander Chen visualized “You Still Believe in Me” by the Beach Boys.
This… -
Introduction to R, a video series by Google
Google released a 21-part short video series that introduces R. Most of the…
-
Seeking a career in visualization
Some readers asked about career choices in visualization recently, and I was about…
-

Listening to Zen-like Wikipedia edits
It’s easy to think of online activity as a whirlwind of chatter and…
-

Racial dot map
Dustin Cable, a demographer at the University of Virginia’s Weldon Cooper Center for…
-

A second on the Internet →
In a straightforward view of online activity, Designly shows the approximate number of…
Recently for Members
Second Edition
 Visualize This: The FlowingData Guide to Design, Visualization, and Statistics (2nd Edition)
 Visualize This: The FlowingData Guide to Design, Visualization, and Statistics (2nd Edition)
New tools, refined process.
Browse by Chart Type See All →


