• Membership
  • Books
  • Projects
  • Learning
  • Newsletters
  • Member Login
  • Taxicab Geometry

    August 5, 2025

    Topic

    Infographics  /  geometry, New York Times, taxi

    For the New York Times, Steven Strogatz explains taxicab geometry through the lens of an Etch A Sketch. It is a world where the Pythagorean theorem does not apply and total distance is simply the sum of a and b rather than the length of a hypotenuse.

  • xkcd globe projections

    August 4, 2025

    Topic

    Maps  /  globe, humor, projections, xkcd

    The problem with two-dimensional map projections is distortion creeps in no matter what you do. The problem with globes on a screen or in print is that they only show the geography facing the viewer. xkcd solved both problems.

  • When other countries shunned their data and statisticians

    August 4, 2025

    Topic

    Statistics  /  government, New York Times, uncertainty

    For the New York Times, Ben Casselman highlights the potential repercussions for shunning agency data with examples from other countries who chose darkness.

    Perhaps most famously, there is the case of Argentina, which in the 2000s and 2010s systematically understated inflation figures to such a degree that the international community eventually stopped relying on the government’s data. That loss of faith drove up the country’s borrowing costs, worsening a debt crisis that ultimately led to it defaulting on its international obligations.

    Ignore and complain all you want, but reality eventually settles in. The person experiences unemployment, we pay the expensive grocery bills, and we see what’s happening in our neighborhoods. Data helps us keep track before the problems grow overly difficult.

  • Predecessor to fired BLS commissioner says firing is damaging

    August 4, 2025

    Topic

    Statistics  /  Bloomberg, Bureau of Labor Statistics, firing, government

    The prior commissioner for the Bureau of Labor Statistics had some things to say about the recent firing of Erika McEntarfer. For Bloomberg, María Paula Mijares Torres and Catherine Lucey report:

    “This is damaging,” William Beach, whom Trump picked in his first term to head the Bureau of Labor Statistics, said on CNN’s State of the Union on Sunday.

    […]

    “I don’t know that there’s any grounds at all for this firing,” said Beach, whom McEntarfer replaced in January 2024. “And it really hurts the statistical system. It undermines credibility in BLS.”

    It seems like more of this is on the way. I keep wondering what is stopping these fired officials going out in a blaze of glory Stephen Colbert-style?

  • Pesky statistics

    August 4, 2025

    Topic

    Statistics  /  Atlantic, takedown

    For the Atlantic, Alexandra Petri on the president’s approach to data:

    And now, at last, Donald Trump has fired the head of the Bureau of Labor Statistics. Once these disloyal statisticians are out of the way, the data will finally start to cooperate. The only possible reason the economy could be doing anything other than booming is Joe Biden–legacy manipulation. The economy is not frightened and exhausted by a man who pursues his tariffs with the wild-eyed avidity of Captain Ahab and seems genuinely unable to grasp the meaning of a trade deficit. No, the numbers are simply not patriotic enough. We must make an example of them! When they are frightened enough, I am sure they will show growth.

  • Commissioner of Labor Statistics fired, because labor statistics were not to president’s liking

    August 1, 2025

    Topic

    Statistics  /  firing, government, jobs, NPR, uncertainty

    The administration disagreed with the jobs count released by the Bureau of Labor Statistics, so the administration is firing the commissioner. For NPR, Scott Horsley reports:

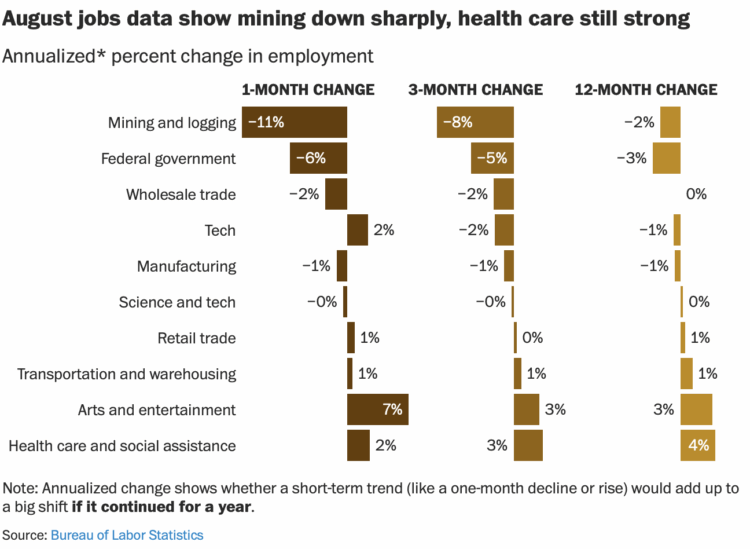
    U.S. employers added just 73,000 jobs in July, according to a report Friday from the Labor Department, while job gains for May and June were largely erased. The unemployment rate inched up to 4.2%.

    Hours after the report, Trump advanced baseless claims about the jobs numbers, writing on social media that he thought they “were RIGGED in order to make the Republicans, and ME, look bad.”

    In another post, Trump said he was firing Erika McEntarfer, the head of the Bureau of Labor Statistics, which puts out the jobs report. McEntarfer was appointed to the job by former President Joe Biden.

    In other news, you can now achieve your weight goals by throwing out the scale, which is simply out to get you.

  • Tariff tracking by country

    August 1, 2025

    Topic

    Maps  /  New York Times, tariff

    From Lazaro Gamio, Tony Romm, and Agnes Chang for the New York Times, keep track of the tariff status for each country in cartogram form. Each country is scaled by the size of 2024 imports and color-coded by status: new rate, upcoming deadline, deal rate, or baseline.

    There is a standard geographic world map by default, which is maybe more familiar for readers, but the cartogram shows a more meaningful picture of scale.

  • Map drawing with a single line

    August 1, 2025

    Topic

    Maps  /  drawing, line

    Just One Line is a fun project that recreates city maps with a single, hand-drawn line. This seems like a good, calm way to spend a Saturday evening.

  • Federal data more at risk, a report from American Statistical Association

    August 1, 2025

    Topic

    Statistics  /  American Statistical Association, government, risk

    The American Statistical Association released a report last year on the growing challenges for federal agencies to collect high-quality data about the country. The year two status report stresses how the situation is worsening.

    Declining budgets, staffing constraints, and inadequate statistical integrity protections identified in the 2024 report have intensified in recent months and have further set back efforts to modernize the nation’s statistical infrastructure. Modernization is essential, given declining public willingness to respond to surveys and the need to use multiple data sources to maintain quality. The U.S. decentralized approach makes it harder for agencies to establish collaborative partnerships, innovate, and protect their work from budget pressure—cuts to one agency can affect the entire system. As just one example, the Bureau of Economic Analysis (BEA) relies on multiple sources of data from federal statistical and programmatic agencies and the private sector to produce estimates of Gross Domestic Product, Personal Income, and other components of the National Income and Product Accounts.

    Along with the ongoing government data takedowns, it seems we’re headed towards a fuzzier path where it’s more difficult to verify or refute anecdotes.

  • Running an LLM on your laptop

    August 1, 2025

    Topic

    Software  /  Large Language Model, local, MIT Technology Review, privacy

    When you use a chatbot with companies like Google or OpenAI, your chats and data can be used to train models that spit out bits to others. As always, there is value in owning your data and controlling who gets to see and use it. For MIT Technology Review, Grace Huckins outlines the reasons to run LLMs locally and how to get started.

    Training may present particular privacy risks because of the ways that models internalize, and often recapitulate, their training data. Many people trust LLMs with deeply personal conversations—but if models are trained on that data, those conversations might not be nearly as private as users think, according to some experts.

    “Some of your personal stories may be cooked into some of the models, and eventually be spit out in bits and bytes somewhere to other people,” says Giada Pistilli, principal ethicist at the company Hugging Face, which runs a huge library of freely downloadable LLMs and other AI resources.

    For Pistilli, opting for local models as opposed to online chatbots has implications beyond privacy. “Technology means power,” she says. “And so who[ever] owns the technology also owns the power.” States, organizations, and even individuals might be motivated to disrupt the concentration of AI power in the hands of just a few companies by running their own local models.

  • Transformation of data centers to build out AI in the real world

    July 31, 2025

    Topic

    Artificial Intelligence  /  data center, Financial Times

    To everyday users, AI might just seem like another thing that shows up on the screen. A collection of code, data, and bits wrapped into a chatbot. However, the new toys require exponentially more resources, which require space in the real world. Financial Times shows this new iteration of reality with graphics, charts, and maps.

    Long ago, I visited a data center that looked more like the illustration on the left. There were racks and a lot of fans, loosely organized and probably not that efficient. The scale of these modern data centers is wacky.

  • Odds against a sports betting king

    July 31, 2025

    Topic

    Statistics  /  gambling, Mazi VS, New York Times, outlier, sports

    For New York Times Magazine, Devin Gordon profiled popular oddsmaker Mazi VS, a sports gambler who sells picks and get-rich dreams. The problem is that his claims, like a 70% win rate, don’t match with real-world odds.

    It’s also worth noting that every sharp and every oddsmaker I spoke with for this article pointed out that if Mazi really wins at the rate he claims, most of the sportsbooks he bets at would never take his action. “You kind of tell on yourself when you show big tickets constantly,” Gadoon Kyrollos, a much-admired pro gambler, known as Spanky, who co-founded the Sports Gambling Hall of Fame two years ago, told me. “You’re trying to say, ‘Look — I’m a big winner.’ But for anybody that has a clue, we know the reality is that you’re fundamentally a loser.” Casinos also keep close tabs on the betting patterns of their regular customers, especially the winners. “The folks I know on, let’s say, both the light and dark sides of the street — we know who’s out there,” Brennan told me. “We know who’s for real and who isn’t, and I can tell you for a fact, Mazi isn’t anywhere near that list, isn’t in consideration, an honorable mention, any of that.”

    If the odds sound too good to be true, especially when money is involved, they probably are.

    This story was so good, from beginning to end.

  • Members Only

    Visualization Tools, Datasets, and Resources — July 2025 Roundup

    July 31, 2025

    Topic

    The Process  /  roundup

    Tools to use, datasets to poke at, resources to learn from. This is the good stuff for the month.

  • Policy timelines for the Big Beautiful Bill

    July 31, 2025

    Topic

    Infographics  /  OBBB, policy, taxes, USAFacts

    The OBBB introduced policies for taxes, government assistance, student loans, and immigration, with varying timelines and types of changes. USAFacts provides a reference that shows start and end dates for each policy, with colors to indicate if a policy is new, an end to a current policy, an expansion, or a restriction.

    The view provides clarity for something that can seem amorphous to casual onlookers.

  • Storing PNG image data in a bird’s song

    July 30, 2025

    Topic

    Statistics  /  Benn Jordan, birds, song, spectrogram, storage

    Birds have a strong ability to learn and mimic sounds. So, Benn Jordan converted a PNG image into a spectrogram and then played the resulting sound to a starling, a bird known for its mimicking. The starling was able to copy the sound, thus demonstrating an ability to store data in its song.
    Read More

  • Increased immigration arrests and deportations

    July 30, 2025

    Topic

    Statistical Visualization  /  arrests, deportation, Guardian, immigration

    For the Guardian, Maanvi Singh, Will Craft, and Andrew Witherspoon show the sharp increase in arrests, deportations, and detentions that began soon after inauguration. It’s a lot, pretty much any way you cut the data.

  • Usage and management of public lands

    July 29, 2025

    Topic

    Maps  /  atlas, land, public, Reuters

    The administration is pushing policies to open public land, some 59 million acres of national forest, for road construction and drilling. For Reuters, Ally Levine, Soumya Karmwa, and Travis Hartman mapped and charted current usage and management, emphasizing the importance of these protected areas.

    Public lands have balanced a variety of uses from drilling for oil and gas, mining for various minerals and logging to conservation and recreation. Each use is meant to serve the public good. But as the U.S. government has changed over time, what it considers “good” also has changed.

    They went with the 1800s statistical atlas aesthetic and maps a la Reinhard, which I full-heartedly support. Bonus points for the water lines in the Sankey diagram.

  • Analysis of all the words used on NYC streets

    July 28, 2025

    Topic

    Maps  /  Matt Daniels, New York, Pudding, words, Yufeng Zhao

    Yufeng Zhao extracted words found in millions of publicly available Google Street View images between 2007 and 2024. He made a search engine for the scraped data so that you can see where the words appear in images and geographically.

    Matt Daniels gave the dataset the Pudding treatment. Some words are found citywide, but others are unique to specific areas. Might be useful for certain GeoGuessr players.

  • Counting Trump’s comments about Powell

    July 25, 2025

    Topic

    Statistical Visualization  /  Christine Zhang, Jerome Powell, New York Times, words

    For the New York Times, Christine Zhang counted Trump’s comments about Jerome Powell, chair of the Federal Reserve, over the president’s first and current term. They are marked as compliments (not so many now) and insults (many more now):

    The New York Times analyzed what Mr. Trump has said about Mr. Powell on social media and in public interviews and press conferences during his first and second terms. In his second term, Mr. Trump has targeted Mr. Powell on approximately 43 separate occasions, all of them since April. The attacks have far outpaced those made during the entirety of Mr. Trump’s first four years in office, over which he critiqued Mr. Powell on about 30 occasions.

  • Young workers not replaced yet

    July 25, 2025

    Topic

    Artificial Intelligence  /  education, Financial Times, jobs

    As work evolves with automation seemingly everywhere, one might expect to see shifts in the workforce. Jobs more likely affected by generative AI should show greater changes. Financial Times, turning attention to incoming workers, shows that such a correlation has not appeared yet.

    The best bit comes outside the article by FT journalist Clara Murray. An AI-generated site shows an attempt to summarize the article, but unable to get around the FT paywall, the generated article is just a summary of the FT subscription pitch.

  • Page 1 of 398
  • 1
  • 2
  • 3
  • 4
  • 5
  • 6
  • ...
  • 398
  • >

Support an independent FlowingData, and get extra visualization goodness.

Become a member →

Recently for Members

July 31, 2025
Visualization Tools, Datasets, and Resources — July 2025 Roundup

July 24, 2025
Visualization and the machine

July 17, 2025
Ignoring audience

July 10, 2025
Switching axis positions

July 3, 2025
Questions to visual answers

Second Edition

Visualize This: The FlowingData Guide to Design, Visualization, and Statistics (2nd Edition)

New tools, refined process.

Order: Amazon / Bookshop

Browse by Chart Type See All →

Sankey Diagram Voronoi Diagram Moving Bubbles Spike Map Pyramid Chart Parallel Coordinates Network Graph Word Cloud Variable Width Bar Chart Strip Plot

Browse By Topic

  • Visualization

    Seeing data

  • Maps

    Seeing geographic data

  • Infographics

    Explaining data

  • Networks

    Connecting data

  • Statistics

    Analyzing data

  • Software

    Working with data

  • Sources

    Getting data

  • Design

    Making data readable

Made by FlowingData

  • The Process

  • Data Underload

  • Chart Everything

  • Guides

  • Books

  • Shop

  • About
  • Contact
  • LinkedIn
  • Instagram
  • Bluesky
  • RSS
Copyright © 2007-Present FlowingData. All rights reserved.