My main goal for FD this year was to make charts.
I hoped to make one chart per week, along with the newsletter and tutorials, which would force me to focus and spend less time dwelling on a dataset. I didn’t quite get to one per week, but I made about twice as many graphics as I did last year. I’ll take it.
Instead of long-ish, in-depth analyses, I usually looked at one dataset from various angles, making one or two graphics per angle. Basically, instead of essays, I opted for small collections of short stories.
So, here are the most popular topics/datasets and their accompanying charts.
1. Paths to Marriage
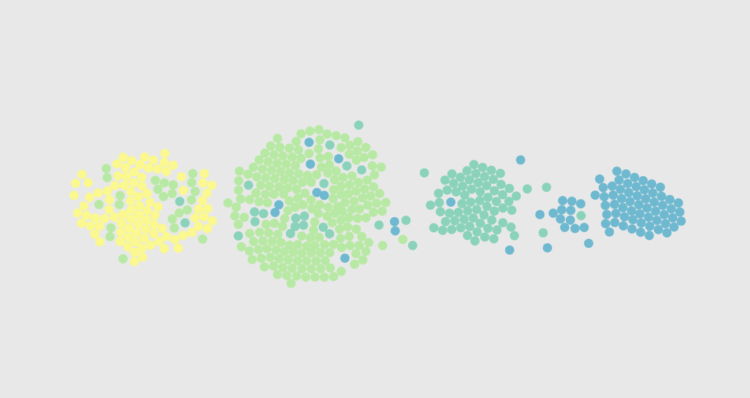
The How Couples Meet and Stay Together dataset was fun to look at, because it provided details for individual relationships and was a peek into the “So how’d you two meet?” question for hundreds of relationships.
- I started with how people meet these days.
- Then I wondered about how it has changed.
- What happens after meeting? Here’s how the marriage timeline changed.
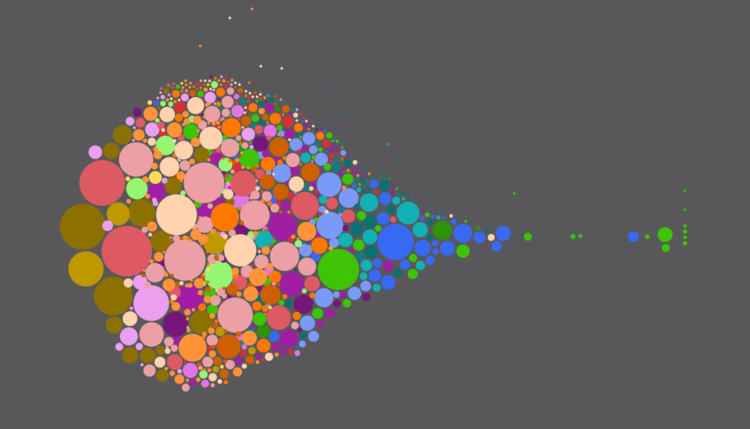
- Finally, an animated bubbly look at the timeline.
2. How Sleep Patterns Change with Age
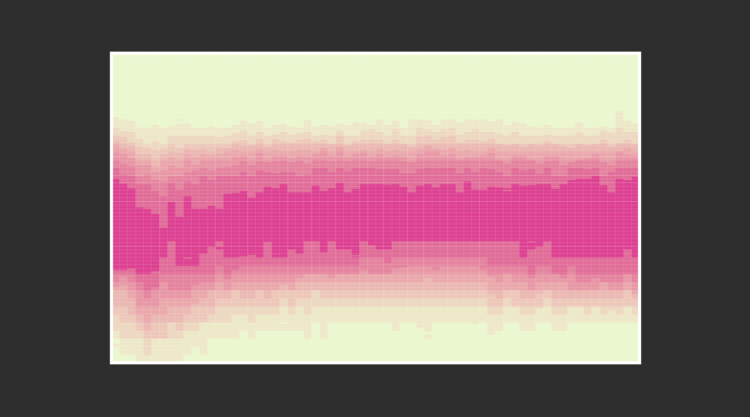
The American Time Use Survey is the dataset that keeps on giving.
- I wake up almost every night now. Is it going to get worse? Yes. The animated chart was one the most disliked charts I ever made. Pretty awesome.
- I followed up with a wider view of sleep schedules.
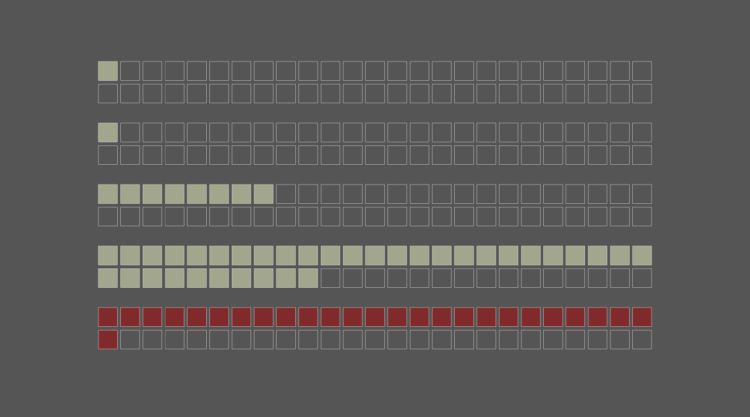
3. How Much Money People Make
Is your salary high enough? What do other people make? The American Community Survey provided a detailed view.
- With a definition of “middle-income” in hand, I wondered what percentage of people actually fall into the definition.
- I also looked at it by household size and state.
- Then there was salary by occupation.
4. Saving for Retirement
There was an article going around quoting some age when people reach $100k in savings. I was curious about the details, because I’m getting old. The Survey of Consumer Finances provided a peek.
- I started by looking at age and the $100k threshold for retirement savings.
- Then I looked at the wide variation of how much people save over time.
- Finally, savings recommendations.
5. Looking for Work-Life Balance (with Kids)
As someone who is self-employed and works from home, I am constantly in search of the perfect balance because work and home are so tightly-knit for me. And kids change everything. I also often wonder about others’ day-to-day. I came back to the American Time Use Survey and the American Community Survey.
- Having looked at a day in the life of Americans before, I compared a day in the life for men and women.
- The ATUS has been around since 2003, which allowed a contrast of time use now against 15 years ago.
- Sometimes I fantasize about a career shift.
- I don’t envy long commutes though. How much is too much commute? I also mapped when people start their commutes in the morning.
- I wondered how life changes when you have kids.
- Finally, I compared the jarring time shift between moms and dads.
For me, this year was about staying more focused and being productive. I’ll try to maintain the same focus next year, but I’ll try to take more side routes in hopes of finding new toys to play with.
A Year of Members-Only
I’ve had memberships on FD for almost eight years now, but this was the first full year the site was completely member-supported. It seems to be working. Thank you to everyone who continues to support this little site of mine.
Next year is going to be bigger and better.
At the end of this year, I introduced a sample of what’s to come. For a long time, it’s just been me around here, but you’ll see new points of view and new visualization tools. I also have new projects for members in the queue. It should be fun.
Thank you for reading. Thank you for supporting.
Looking to Visualization in 2020
I think we can all agree that visualization is a bonafide thing now. Big companies are spending many dollars on buying visualization companies. There are books aplenty. There are tools aplenty.
Ten years ago, I was sitting in a database class and we were making introductions. I said I was in statistics with a focus on data visualization. The guy next to me taking notes on his laptop typed, “Data visualization????” as a reminder to look it up later on.
These days, I tell non-data people what I do, and some are already familiar with the field. What progress.
So we’re in a good place.
That said, while I’m glad visualization is taken seriously now, I hope that we still leave room for fun and novelty next year. That’s all I want. The rest will take care of itself.
See you all next year. Let’s make it a good one.