When People Find a New Job
In our teens and early twenties, we’re still figuring out what we want to be when we grow up. As we get older, we start to settle into a career. In between, we switch jobs in the search. Based on data from the Current Population Survey, this is when people make the switches and the jobs they switch to.
Peak Age for Job Switches
Looking at the 100 most common jobs people switched to, a timeline comes into view when we adjust the relative switch rates by age.

AGE IN YEARS
15
20
25
30
35
40
45
50
55
60
65
70
75
80
85
90
Athletes, coaches, umpires, and related workers
Switches to these occupations peaked during teenage years, probably first jobs for many.
Hosts and hostesses, restaurant, lounge, and coffee shop
Cafeteria attendants and misc. food preparation workers
Misc. entertainment attendants and related workers
Counter attendants, cafeteria, food concession
Food preparation workers
Janitors and building cleaners
Waiters and waitresses
Cashiers
Cleaners of vehicles and equipment
Cooks
Chefs and head cooks
Welding, soldering, and brazing workers
Shipping, receiving, and traffic clerks
Food preparation and serving workers, including fast food
Child care workers
Stock clerks and order fillers
Retail salespersons
Butchers and meat, poultry, and fish processing workers
Billing and posting clerks and machine operators
Packaging and filling machine operators and tenders
Dishwashers
Miscellaneous agricultural workers
Customer service representatives
Driver/sales workers and truck drivers
Laborers and freight, stock, and material movers, hand
Sales and related workers, all other
Preschool and kindergarten teachers
Postsecondary teachers
Teacher assistants
Security guards and gaming surveillance officers
Miscellaneous assemblers and fabricators
Secretaries and administrative assistants
Nursing, psychiatric, and home health aides
Computer systems analysts
Data entry keyers
Recreation and fitness workers
There is a lot of change in our twenties.
Tellers
Inspectors, testers, sorters, samplers, and weighers
Registered nurses
Food service managers
Elementary and middle school teachers
Personal and home care aides
Receptionists and information clerks
Medical assistants
Health practitioner support technologists and technicians
Computer support specialists
Managers of food preparation and serving workers
Sales representatives, services, all other
Designers
Hairdressers, hairstylists, and cosmetologists
Sales representatives, wholesale and manufacturing
Other teachers and instructors
Office clerks, general
Maids and housekeeping cleaners
Secondary school teachers
Social workers
Painters, construction and maintenance
Industrial truck and tractor operators
Automotive service technicians and mechanics
Carpenters
Grounds maintenance workers
First−line supervisors/managers of retail sales workers
File clerks
Office and administrative support workers, all other
Bartenders
Packers and packagers, hand
Financial managers
Production workers, all other
Construction laborers
Taxi drivers and chauffeurs
Marketing and sales managers
Maintenance and repair workers, general
Computer occupations, all other
Software developers, applications and systems software
Physicians and surgeons
Counselors
Licensed practical and licensed vocational nurses
Accountants and auditors
Human resource workers
Bookkeeping, accounting, and auditing clerks
Occupation switches after thirty commonly reflect experience and education.
Construction managers
Chief executives
Education administrators
Real estate brokers and sales agents
Managers, all other
Miscellaneous personal appearance workers
General and operations managers
Pipelayers, plumbers, pipefitters, and steamfitters
Insurance sales agents
Metalworkers and plastic workers,all others
Management analysts
Property, real estate, and community association managers
Medical and health services managers
Bus drivers
First−line managers of administrative support workers
Lawyers, Judges, magistrates, and other judicial workers
Wholesale and retail buyers, except farm products
Supervisors/managers of non−retail sales workers
Farmers, Ranchers, and Other Agricultural Managers
15
20
25
30
35
40
45
50
55
60
65
70
75
80
85
90
AGE IN YEARS

AGE IN YEARS
15
25
35
45
55
65
75
85
Athletes, coaches, and related
Hosts and hostesses
Teenage years
Cafeteria attendants
Misc. entertainment attendants
Counter attendants
Food preparation workers
Janitors and building cleaners
Waiters and waitresses
Cashiers
Cleaners of vehicles and equipment
Cooks
Chefs and head cooks
Welding, soldering workers
Shipping, receiving clerks
Food preparation and serving workers
Child care workers
Stock clerks and order fillers
Retail salespersons
Butchers and other meat processing
Billing clerks and machine operators
Packaging machine operators
Dishwashers
Miscellaneous agricultural workers
Customer service representatives
Driver workers and truck drivers
Laborers and freight
Sales and related workers, all other
Preschool and kindergarten teachers
Postsecondary teachers
Teacher assistants
Security guards
Miscellaneous assemblers
Secretaries and admin. assistants
Nursing and home health aides
Computer systems analysts
Data entry keyers
Recreation and fitness workers
Tellers
Inspectors, testers, sorters
Registered nurses
Twenties
Food service managers
Elem. and middle school teachers
Personal and home care aides
Receptionists and information clerks
Medical assistants
Health practitioner support tech.
Computer support specialists
Managers of food preparation workers
Sales representatives, services
Designers
Hairdressers and cosmetologists
Sales representatives
Other teachers and instructors
Office clerks, general
Maids and housekeeping cleaners
Secondary school teachers
Social workers
Painters, construction
Industrial truck and tractor ops.
Automotive service technicians
Carpenters
Grounds maintenance workers
Managers of retail sales workers
File clerks
Office and admin. support workers
Bartenders
Packers and packagers, hand
Financial managers
Production workers, all other
Construction laborers
Taxi drivers and chauffeurs
Marketing and sales managers
Maintenance and repair workers
Computer occupations, all other
Software developers
Physicians and surgeons
Counselors
Licensed practical vocational nurses
Accountants and auditors
Human resource workers
Bookkeeping and accounting clerks
Construction managers
Chief executives
Education administrators
Real estate brokers and sales agents
After Thirty
Managers, all other
Personal appearance workers
General and operations managers
Pipelayers, plumbers
Insurance sales agents
Metalworkers and plastic workers
Management analysts
Property managers
Medical and health services managers
Bus drivers
Managers of admin. support workers
Lawyers, Judges, and Magistrates
Wholesale and retail buyers
Managers of non−retail sales workers
Farming and Ranching Managers
15
25
35
45
55
65
75
85
AGE IN YEARS
More specifically, the data comes from about 113,000 survey participants who switched jobs between 2011 and 2018. The Current Population Survey asks for occupation and occupation from the previous year.
The chart above shows the rate by age, relative to the total number of people who switched to each job. So you see a lot of switching in the early years, and then things seem to settle down at older ages. If someone takes a new job when they’re older, it tends towards management or jobs that require more education.
You get a similar pattern when you look at switch rates overall, as shown below.
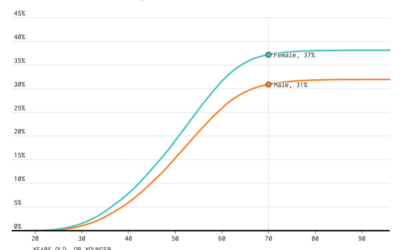
Switching by Age
Out of the people who worked, the percentage who worked a different job the year before drops a lot by mid-20s. There’s another shift post-retirement.

Figuring things out during
the early years.
30%
25%
Time for something new after retirement?
20%
15%
10%
5%
0%
30-34
60-64
75-79
25-29
35-39
50-54
55-59
65-69
80-84
85-89
15-19
20-24
40-44
45-49
70-74
AGE IN YEARS

Figuring things out during
the early years.
30%
Time for something new
after retirement?
25%
20%
15%
10%
5%
0%
15
25
35
45
55
65
75
85
AGE IN YEARS
The sudden increase after retirement age is interesting. Remember that this is out of people who are still working, so I suspect a new interest after retirement, or more likely, a need for a new source of income.

Switching Jobs
Given any occupation, here’s where people switch to.

Constructed Career Paths from Job Switching Data
You can do anything you want to do.
Notes
- The data for 2011 through 2018 comes from the Current Population Survey, which is run by the Census Bureau and the Bureau of Labor Statistics. I downloaded the data via IPUMS.
- I analyzed the data and made the frequency trails chart in R. Relevant tutorial: How to Make Frequency Trails in R.
Chart Type Used

Become a member. Support an independent site. Get extra visualization goodness.
See What You Get