
When Americans Reach $100k in Savings
There was a statistic going around that said 1 in 6 millennials have at least $100,000 saved. The reactions were mostly confusion and indignation. They were along the lines of, “I don’t know a single millennial with $1,000, much less $100,000.” Or, “Maybe $100,000 of debt, amirite.”
Is 1 in 6 such an impossible statistic? Short answer: No.
Like most things with data, it’s about numbers and definitions.
Let me explain.
The 1 in 6 figure comes from a report (pdf) commissioned by Bank of America in 2017. They defined a millennial as someone who was 23 to 37 years old. This is slightly older than the more standard definition set by the Pew Research Center: born from 1981 to 1996, or 21 to 36 during the survey year.
I don’t have access to the Bank of America survey, but the Survey of Consumer Finances (SCF) from the Federal Reserve Board provides more detailed information. I calculated the +$100k percentages for millennials using both millennial definitions:
Passing $100k in Savings
When looking at only transaction accounts, such as checking and savings, the 1 in 6 figure, or 17%, seems high.
| More than $100k in… | Age 21 to 36 (Pew) | 23 to 37 (BofA) |
|---|---|---|
| Savings | 0.4% | 0.9% |
| Checking | 0.2% | 0.3% |
| All Transaction Accounts | 1.2% | 1.8% |
The older ages for the BofA definition pushes the percentages up, but none are close to 17 percent.
Although, the report never defines “savings.” It reads like money in a savings account, but maybe they also mean other sources, like a retirement account, stocks, and bonds. When you have that much money, I think most people don’t just leave it laying around in a low-interest bank account.
Here’s what you get when you include other assets:
Passing $100k Elsewhere
When looking at all assets, the percentages rise a lot.
| More than $100k in… | Age 21 to 36 (Pew) | 23 to 37 (BofA) |
|---|---|---|
| Financial Assets | 7.5% | 9.8% |
| All Assets | 35.1% | 39.9% |
Remember that a house counts as an asset, and based on the SCF, almost 40 percent of millennials have over $100,000 in assets.
However, with that house usually comes debt. Factor that into the equation and you get net worth:
Passing $100k Net Worth
Factor in debt, and you get the 17% we’ve been looking for.
| More than $100k in… | Age 21 to 36 (Pew) | 23 to 37 (BofA) |
|---|---|---|
| Debt | 25.7% | 29.2% |
| Net Worth | 17.7% | 20.4% |
So there you go. That 1 in 6 figure doesn’t seem that crazy, depending on what you define as “savings” and “millennial.” Again, the SCF is at the household level, so I suspect the 20 percent with a +$100k net worth under the BofA definition would be closer to 17 percent if I had data at the individual level.
All the Age Groups
Okay, maybe a net worth of more than $100,000 still seems a little out there. But I think there are two main factors here to consider.
First, 1 in 6 is about 17 percent. That’s a small fraction of millennials. The remaining 83 percent do not have $100,000. That’s high. If there’s an 83 percent chance it’s going to rain, you bring an umbrella.
Second, the definition of millennial is a wide age range. It includes people still in school and just out of college, up to people who have been working for more than 15 years.
So looking at savings for just millennials is not so useful.
It’s a lot more useful to look at the data linearly. The charts that follow show assets, debt, and net worth by age group, in five-year increments instead of using a dumb age classification.
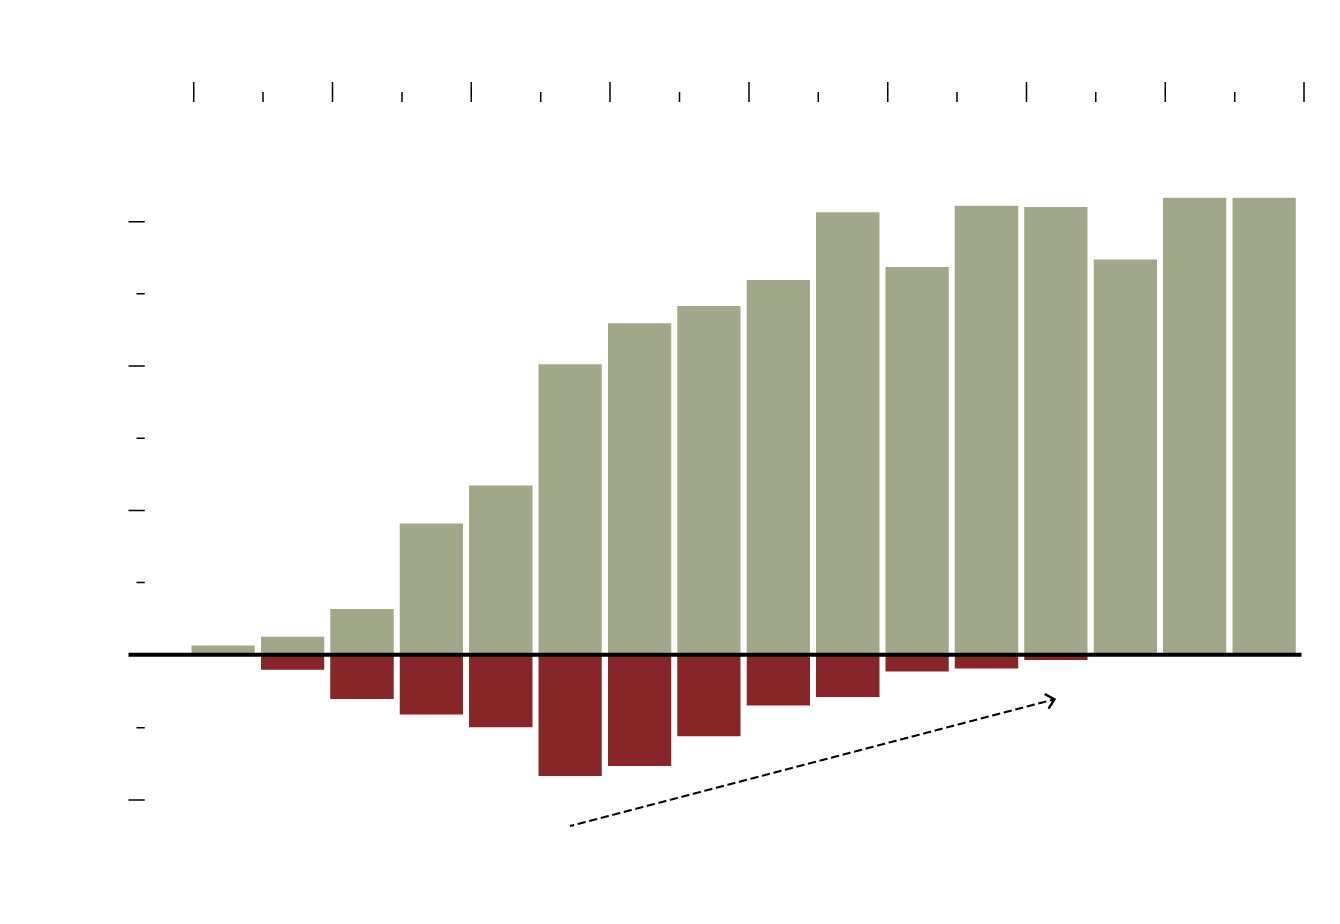
By Age Group
More Assets, More Debt
But eventually less debt…
YEARS OLD
18
25
35
45
55
65
75
85
95
ASSETS
Median
This includes all financial and non-financial assets.
$300k
$200k
$100k
$0k
This includes mortgages, lines of credit, credit card debt, and loans.
After the big home purchase, the journey to zero debt begins.
-$100k
DEBT
Median
SOURCE: SURVEY OF CONSUMER FINANCES, 2016
YEARS OLD
18
25
35
45
55
65
75
85
95
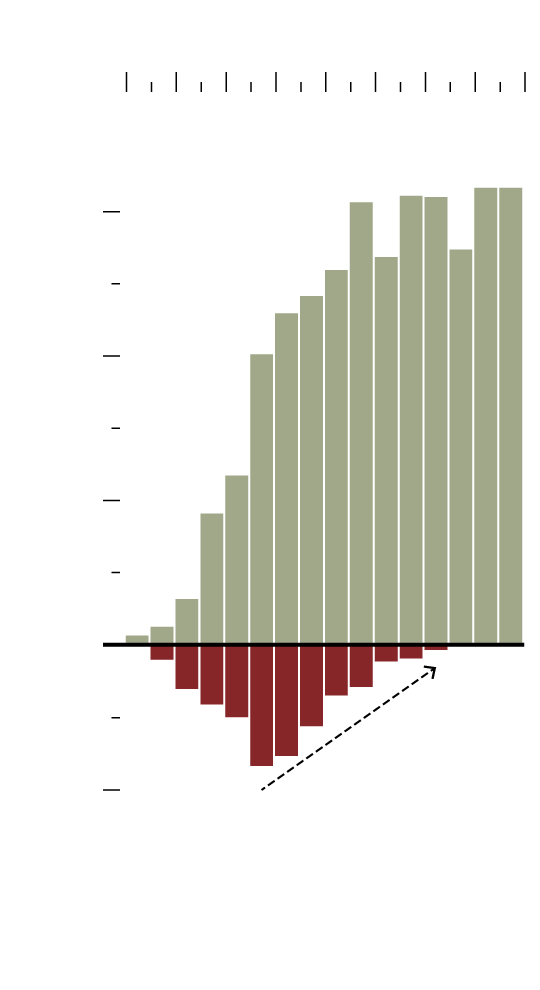
ASSETS
Median
This includes all financial and non-financial assets.
$300k
$200k
$100k
$0k
The journey to zero debt.
-$100k
This includes mortgages, lines of credit, credit card debt, and loans.
DEBT
Median
SOURCE: SURVEY OF CONSUMER
FINANCES, 2016
As you’d expect, assets and debt are lower at younger ages. As you get older, you make larger purchases, accrue more debt, and then slowly pay it off.
Here’s median net worth by age group, which shows a similar trend:
By Age Group
Net Worth
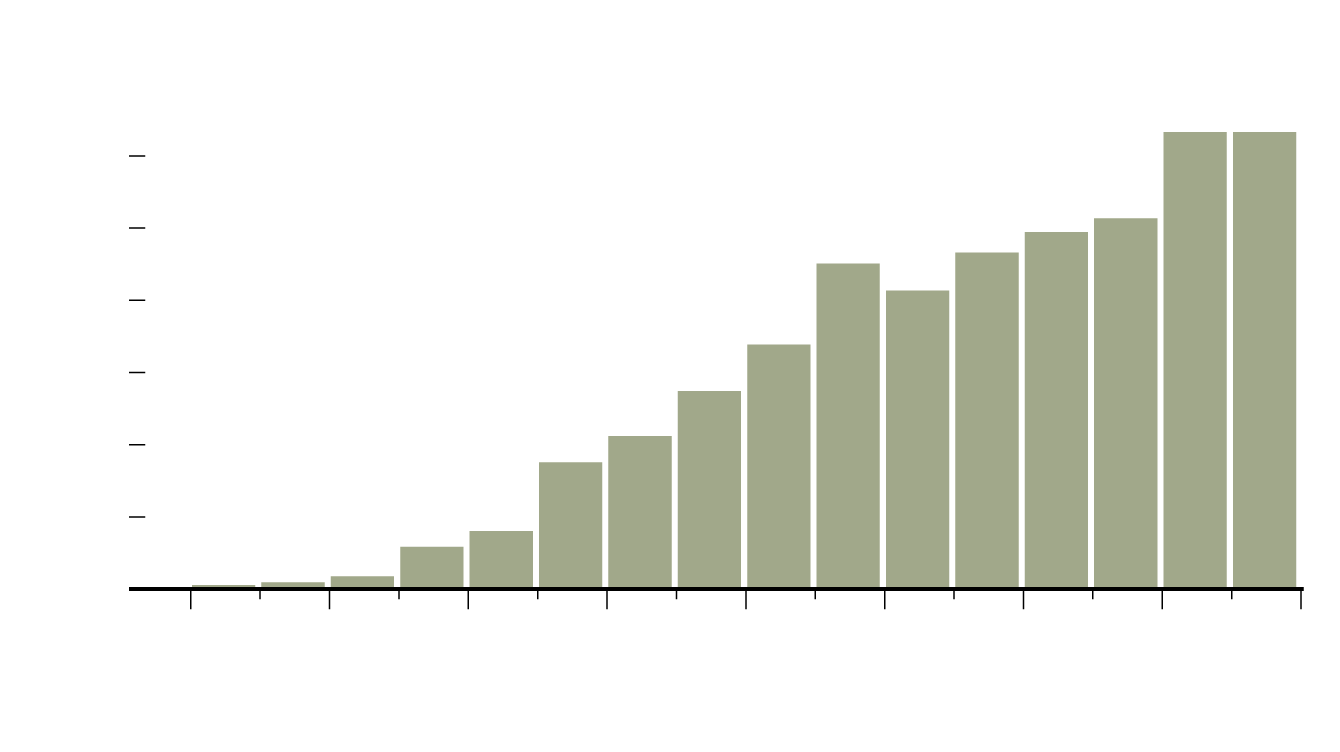
Subtract debt from assets, and you get net worth.
NET
WORTH
Median
$300k
$250k
$200k
By late 40s, more households have at least a $100,000 net worth than those who do not.
$150k
$100k
$50k
$0k
18
25
35
45
55
65
75
85
95
YEARS OLD
SOURCE: SURVEY OF CONSUMER FINANCES, 2016
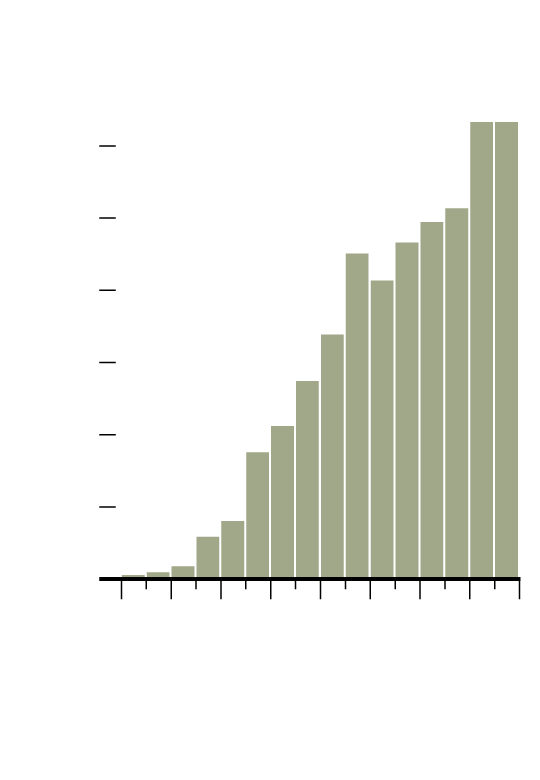
NET
WORTH
Median
Subtract debt from assets, and you get net worth.
$300k
$250k
$200k
$150k
$100k
$50k
$0k
18
25
35
45
55
65
75
85
95
YEARS OLD
SOURCE: SURVEY OF CONSUMER
FINANCES, 2016
The drop around retirement age is interesting. I wonder if that’s noise or real. I’ll have to look into that later. It seems to make sense though.
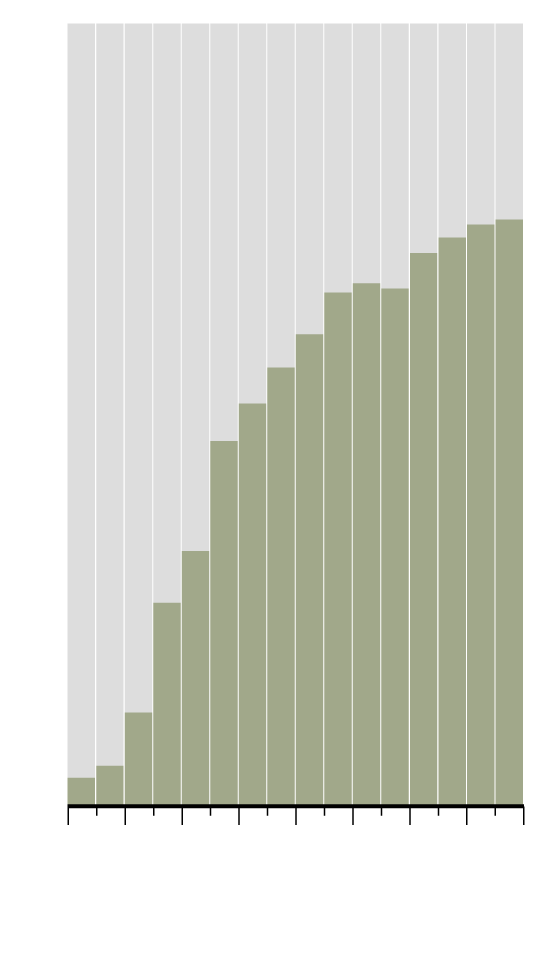
Finally, let’s go back to where we started. Here are the percentages of people with at least $100,000 in net worth, by age group (not just millennials):
By Age Group
Who Has At Least $100k Net Worth
Net worth tops out in the later years.
100%
80%
60%
40%
20%
0%
18
25
35
45
55
65
75
85
95
YEARS OLD
SOURCE: SURVEY OF CONSUMER FINANCES, 2016
100%
80%
60%
40%
20%
0%
18
25
35
45
55
65
75
85
95
YEARS OLD
SOURCE: SURVEY OF CONSUMER
FINANCES, 2016
By your 40s, it’s more common to have a net worth of more than $100,000 than not. Net worth tops out in the later years, as debt is (hopefully) paid off and the value of investments and a house (hopefully) rises.
So is 1 in 6 an impossible statistic? No, but it depends on your definitions — of everything. Be careful in your analysis. Be careful in your interpretations.
Notes
- The data comes from the 2016 Survey of Consumer Finances. I originally downloaded the microdata via the Federal Reserve Board, but then I quickly thought better and grabbed a subset via the UC Berkeley-hosted Survey Documentation and Analysis extraction tool.
- While reading definitions, I was reminded that I’m a millennial. I felt young again for a moment, but then I remembered that the millennial classification is dumb.
- I made the charts in R.
Become a member. Support an independent site. Make great charts.
See What You GetFlowingData is made possible by supporting members. Since 2007, I, Nathan Yau, a real person, have been analyzing and visualizing data to help more people understand and appreciate it in their everyday lives.
If you liked this or want to make similar data things, please consider supporting this small corner of the internet. You get unlimited access to visualization courses, tutorials, and extra resources. Thanks. — Nathan
Chart Types Used

