Stamen Design is the cover story of this month’s Icon Magazine. Well deserved.…
2012
-
Infographics are like Mother’s Day cards
-
Link
Sparse Matrices in R →
Making use of the Matrix and glmnet packages
-
Link
Toner V2 →
Stamen updated their custom black and white map tiles, looking even classier
-
Link
Intro to Statistics →
Free course on extracting meaning from data
-
Link
Huffington Post Pollster API →
Data for 215k responses from 13k polls
-
Members Only
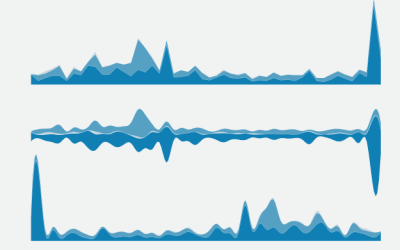
How to Make Stacked Area Charts in R
From the basic area chart, to the stacked version, to the streamgraph, the geometry is similar. Once you know how to do one, you can do them all.
-
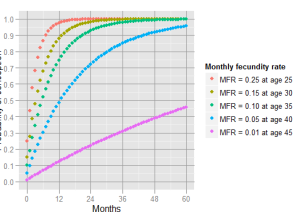
How long it takes to get pregnant
The odds of getting pregnant after a certain time trying are surprisingly hard…
-
Link
Walking the tightrope of visualization criticism →
Avoiding the knee jerk scoff
-
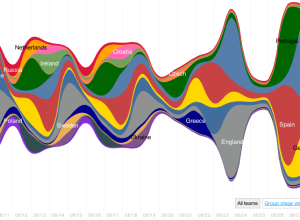
A graphical summary of Euro 2012 on Twitter
Nicolas Belmonte, a data visualization scientist at Twitter, visualized the change in tweet…
-
Link
Visualizing contest for Olympics →
Prize for interactive, static, and people’s choice; deadline July 27 opening ceremonies
-
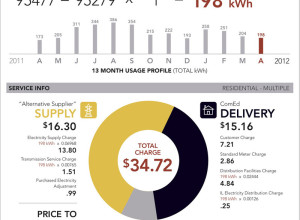
Electricity bill redesigned
The electricity bill (or all utility bills, really) haven’t changed much over the…
-
Build a pop song, pick the right pieces
Voice producer Kuk Harrell works with performers like Justin Bieber and Rihanna to…
-
Link
Flickr maps →
Partnered with Nokia for more detailed georeferencing
-

The Louis C.K. pain chart
Vulture illustrated the subtle changes in Louis C.K.’s face to express varying levels…
-
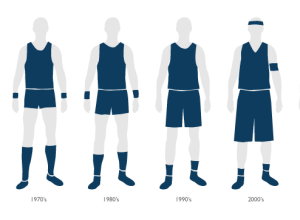
Growth of the basketball uniform
In the 1960s, the basketball uniform was about small, tight shorts and form-fitting…
-
Link
Will A Graphic Resume Get You The Job? →
In short: No.
-
Link
Paper Maps →
Praise for the things made of the stuff that comes from trees
-
Link
Jarvis →
Python coding companion, inspired by Bret Victor talk [via]
-
Link
Walmart Map →
JavaScript version of the the store’s growth [via]
-
Link
Jeff Heer Interview →
Worth listening to whenever he talks visualization
Recently for Members
Second Edition
 Visualize This: The FlowingData Guide to Design, Visualization, and Statistics (2nd Edition)
 Visualize This: The FlowingData Guide to Design, Visualization, and Statistics (2nd Edition)
New tools, refined process.
Browse by Chart Type See All →


