If you’re looking for some data to play with, FiveThirtyEight just made it…
Data Sources
Have fun and play with some numbers.
-
FiveThirtyEight datasets available for download
-
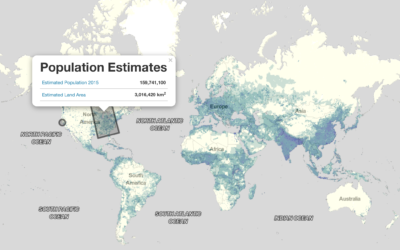
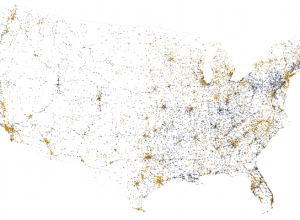
World population estimator and gridded data from NASA
Population data typically comes in the context of boundaries. City data. County data.…
-
Data to identify Wikipedia rabbit holes
New data dump from the Wikimedia Foundation:
The Wikimedia Foundation’s Analytics team is… -
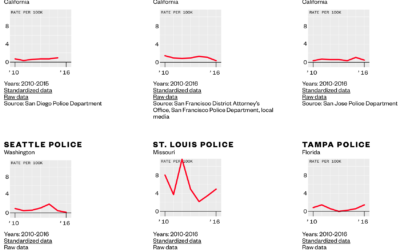
Download comprehensive police shootings data
Data for police shootings is usually the subset that only includes fatalities. Vice…
-
Serial-Killer detector
Alec Wilkinson, reporting for The New Yorker, profiled Thomas Hargrove, who is deep…
-
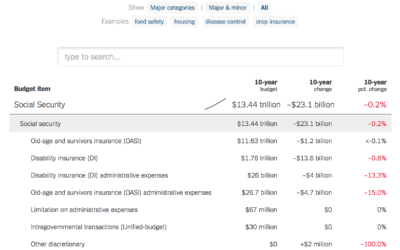
Searchable budget proposal and the 10-year change
The administration released a budget proposal yesterday, which as you’d expect contains some…
-
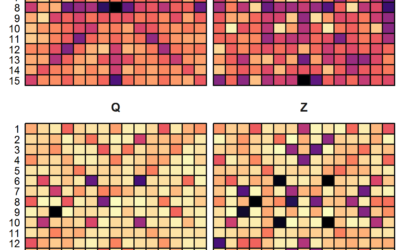
Scrabble data and analysis
Looking for some data to play with? James P. Curley compiled Scrabble data…
-
Easily download large-ish survey datasets
Many government organizations release microdata for surveys every year. It comes as anonymized…
-
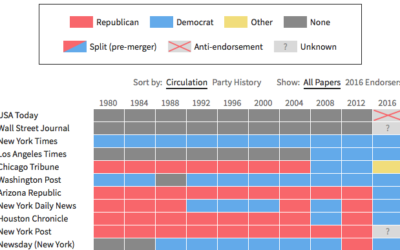
Newspaper endorsements since 1980
Noah Veltman put together a history of newspapers’ presidential endorsements since 1980 for…
-
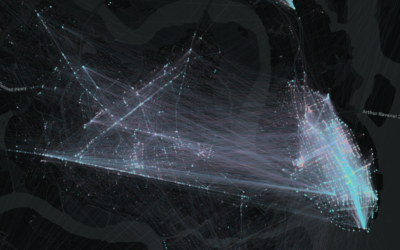
Traffic fatalities data for 2015 released
Each year, the National Highway Traffic Safety Administration releases data for traffic accidents…
-
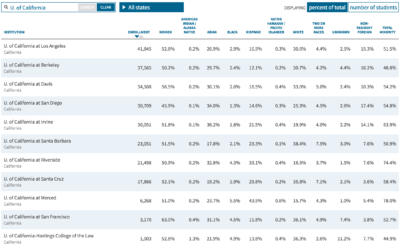
Diversity percentages for US schools
Based on 2014 estimates from the U.S. Department of Education, the Chronicle of…
-
Police surveillance in a digital world
Glenn Smith and Andrew Knapp for the Post and Courier investigate the current…
-
Election DataBot provides a feed of the interesting data stories
There is a ton of election-related data pushed out every day, so much…
-
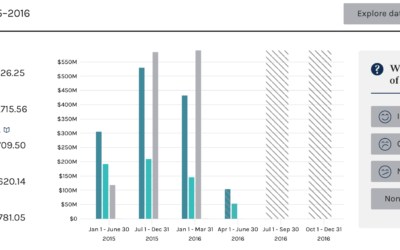
Searchable campaign finance data from the FEC
Every four years, campaign finance data from the Federal Election Commission peeks its…
-
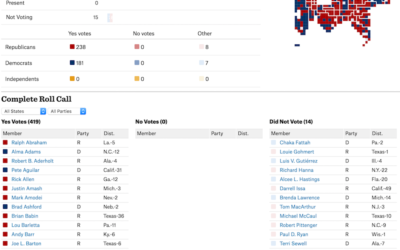
Track what your government representatives are doing for you
Taking over an old New York Times project, ProPublica re-launches Represent, which offers…
-
Emergency room data in R
For my graphic on emergency room visits over time and the other on…
-
Campaign Finance API moves to ProPublica
Back in 2008, the New York Times rolled out a campaign finance API…
-
Catalog of criminal justice data
There’s a lot of data on criminal justice — prison populations, crime rates,…
-
Link
Yahoo News feed dataset for researchers →
A big ol’ dataset on interaction with the list of news items on the homepage.
-
Kaggle Datasets for a place to converge on public data
Kaggle just opened up a Datasets section to download and analyze public data.…
Recently for Members
Second Edition
 Visualize This: The FlowingData Guide to Design, Visualization, and Statistics (2nd Edition)
 Visualize This: The FlowingData Guide to Design, Visualization, and Statistics (2nd Edition)
New tools, refined process.
Browse by Chart Type See All →


