Shan Carter, Amanda Cox, and Kevin Quealy of The New York Times explore…
2009 November
-
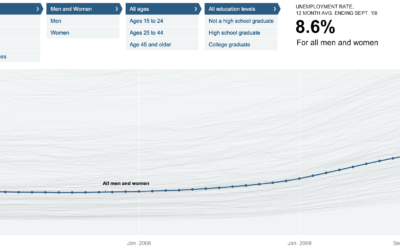
Unemployment Rate For People Like You – NYT Interactive
-
7 Visualization Groups On Flickr to Find Inspiration
I’ve always thought of Flickr as a place where I can share my…
-
Make Thematic Maps With Cartographer.js
Like it or not, Google Maps mashups continue to be a Web favorite.…
-
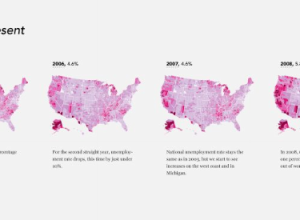
Unemployment, 2004 to Present – The Country is Bleeding
The Bureau of Labor Statistics released the most recent unemployment numbers last week.…
-

Fictional Character Interactions Over Time
Popular nerd comic xckd takes a look at character interactions over time in…
-
FlowingData is On CNN – A new way of looking at the world
Just a quick note. There’s an article up on CNN right now by…
-
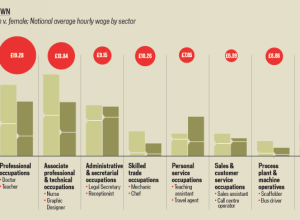
A Land Where Men and Women are Paid Equally
We all know (or at least should know) about the pay gap between…
Recently for Members
Second Edition
 Visualize This: The FlowingData Guide to Design, Visualization, and Statistics (2nd Edition)
 Visualize This: The FlowingData Guide to Design, Visualization, and Statistics (2nd Edition)
New tools, refined process.
Browse by Chart Type See All →


