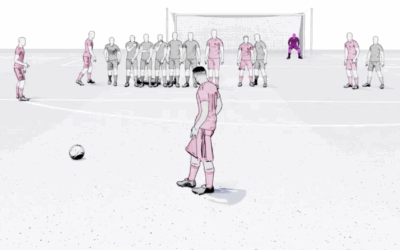
In soccer, a free kick can be awarded after an opponent commits a…
soccer
-
Free kick strategy by Lionel Messi and Cristiano Ronaldo
-
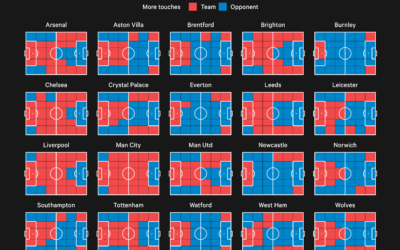
Premier League territory control
The Athletic charted territories on the field to show whether the team of…
-
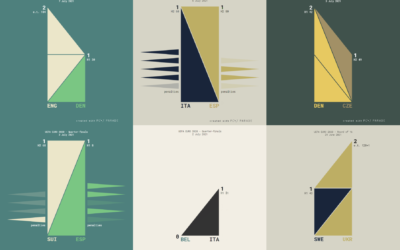
UEFA Euro 2020 matches visualized with triangle sets
Krisztina Szűcs used sets of animated triangles to show how each match played…
-
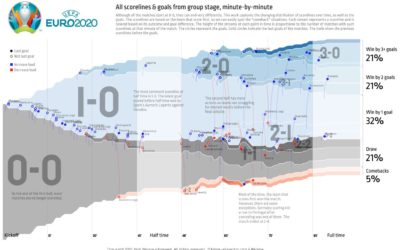
All the matches from Euro 2020 in one chart
To see all the matches from the group stage of Euro 2020 in…
-
All the passes in soccer visualized at once
This is a fun soccer graphic by Karim Douïeb. It shows 882,536 passes…
-
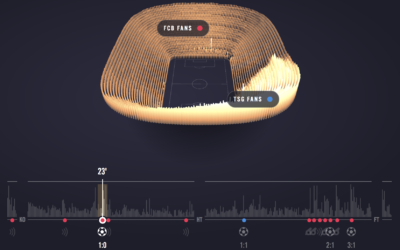
Experience a soccer game through crowd noise
Sports visualization and analysis tends to focus on gameplay — where the players…
-
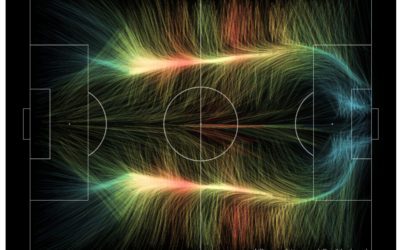
World Cup play activity visualized like wind maps
A fun experiment by Neil Charles that used the aesthetics of wind maps…
-
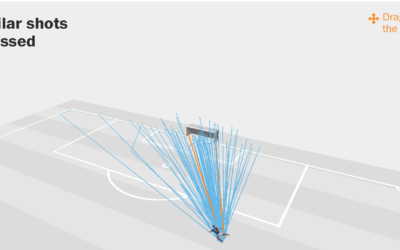
Expected versus actual goals in the World Cup
Benjamin Pavard from France made a low-probability goal the other day. Seth Blanchard…
-
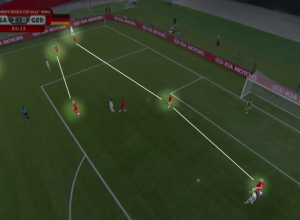
U.S. women’s soccer gameplan
I know next to nothing about soccer. Like there’s nothing, and then I’m…
-
Soccer assists mapped
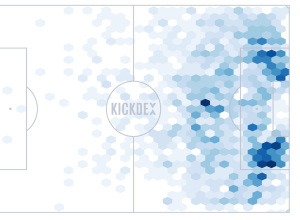
Using Opta data for assists in the Premier League, Kickdex made this straightforward…
-
A graphical summary of Euro 2012 on Twitter
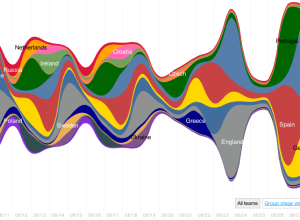
Nicolas Belmonte, a data visualization scientist at Twitter, visualized the change in tweet…


 Visualize This: The FlowingData Guide to Design, Visualization, and Statistics (2nd Edition)


