With cyclical data, a circular format might be useful. Combine that with a smooth density to reduce noise, and you got yourself a plot.
polar coordinates
-
Members Only
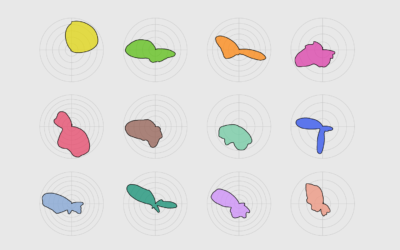
How to Make a Polar Density Plot in R
Recently for Members
Second Edition
 Visualize This: The FlowingData Guide to Design, Visualization, and Statistics (2nd Edition)
 Visualize This: The FlowingData Guide to Design, Visualization, and Statistics (2nd Edition)
New tools, refined process.
Browse by Chart Type See All →


