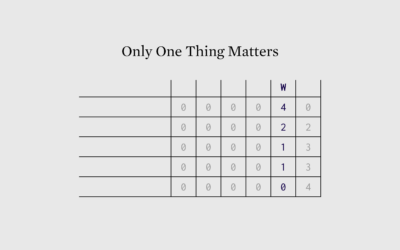
This week we imagine what we would do if the tool we relied on the most were to disappear.
analysis
-
Members Only
Translating Visualization Steps
-
Members Only
Stats Are for Losers
This week, I heard that stats are for losers. I had to check it out, because I’ve always thought stats were for winners.
-
Members Only
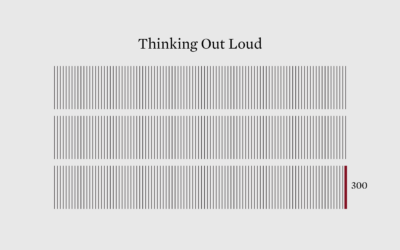
Shifting Visualization Process, 300
This is the 300th weekly issue of The Process. Have things changed? Do we visualize data differently now? Where is this headed?
-
Members Only
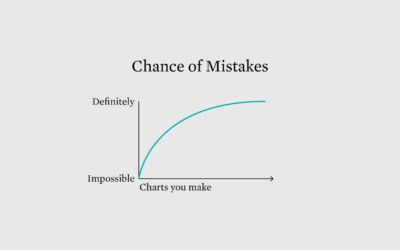
Does the data make sense?
When you analyze data, there are times when a trend, pattern, or outlier jumps out and smacks you in the face. Or, you might calculate results that seem surprising. Maybe they’re real, but maybe not.
-
Members Only
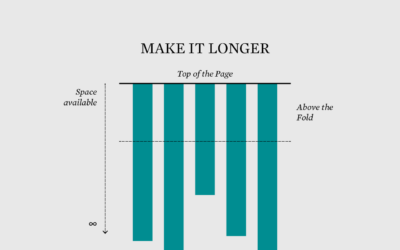
Long Information
There was a time when big infographics ruled, and then their popularity faded as quickly as it came. It wasn’t because of their size though, which might have been the only thing right about them.
-
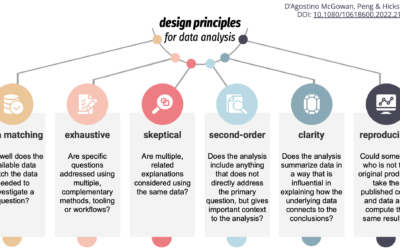
Design principles for data analysis
To teach, learn, and measure the process of analysis more concretely, Lucy D’Agostino…
-
Members Only
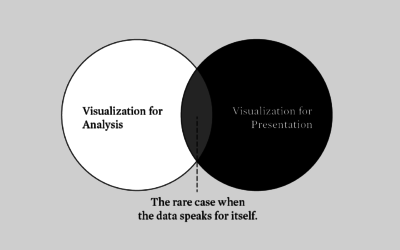
Analytical Stand-in – The Process 146
There’s visualization for analysis. There’s visualization for presentation. There’s overlap between the groups, but the differences require a varied approach.
-
Members Only
Analysis as Detective Work (The Process #62)
Analysis and visualization are often a messy process that never matches up to the step-by-step guides you read, but that’s normal.
-
Members Only
Visualization for Analysis vs. Visualization for an Audience (The Process #59)
The visualizations are used and read differently, which requires that you approach their design differently.
-
Members Only
No Data, Chart Dies
If the charts themselves are fairly straightforward without any dubious design choices, are you still “lying with charts” when only the data itself was manipulated?
-
People relationships in data analysis
Roger Peng discusses the importance of managing the relationships between people — analyst,…
-
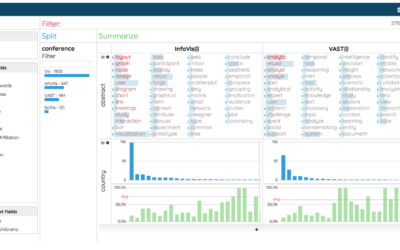
Data visualization for analysis and understanding complex problems
Enrico Bertini, a professor at New York University, delves into the less flashy…
-
Fallacy of point-and-click analysis
Jeff Leek touches on concerns about point-and-click software to find the insights in…
-
Statistics Done Wrong, a guide to common analysis mistakes
Alex Reinhart, a PhD statistics student at Carnegie Mellon University, covers some of…
-
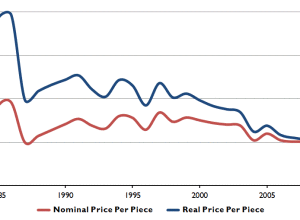
Analysis of LEGO brick prices over the years
Reality Prose has an excellent analysis on the changing price of LEGO bricks…
-
Data visualization doesn’t matter
Visual.ly analyzed the top 30 infographics posted on their site and determined that…
-
Geography of hate
Richard Florida for The Atlantic takes a closer look at hate groups in…






 Visualize This: The FlowingData Guide to Design, Visualization, and Statistics (2nd Edition)


