Are bubble charts effective? This seems to be a recurring question. Some say people suck at comparing areas in the form of bubbles, or rather, people are horrible with areas, period. Others argue that it just takes some getting used to; the eye has to be trained, and once that’s done, the bubbles are good to go.
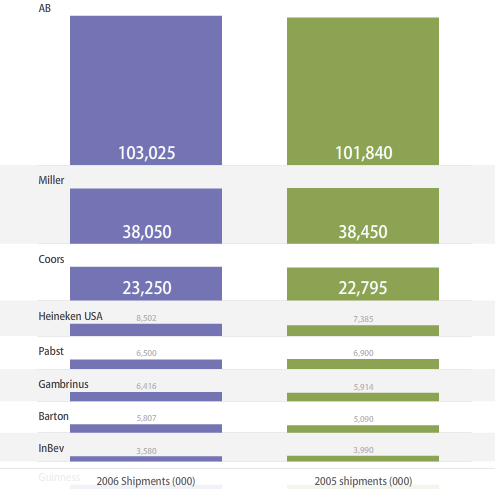
In any case, here is an alternative to the bubbles — bars. The beer data from a previous post are charted (2006 shipments on the left, and 2005 shipments on the right). The advantage of bars over bubbles is that users only have to compare heights; however, numbers are going to clutter quickly as more observations are added.
People should just train their eyes. Bubbles are so much more fun. They’re bubbly.
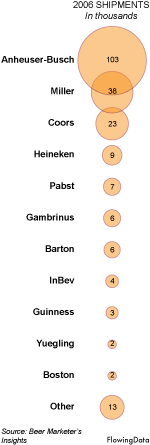 Anheuser-Busch (Budweiser), Miller, and Coors lead the way in beer. Albeit, this is shipment data, not sales data, so take the numbers with a grain of salt.
 One of the things I miss most about going to school is hanging out with my cohort. I work from home in Buffalo, and I get bored and restless pretty easily. When I was at school and feeling restless, I could just go down to the stat lounge, sit on the ridiculous-looking Ikea couch, and relax with some classmates. We never sat around and talked about probability theory or the law of large numbers (ok, maybe we did sometimes), but because we were all stat students, we all had this data-ish way of thinking. Know what I mean?
 Visualize This: The FlowingData Guide to Design, Visualization, and Statistics (2nd Edition)


