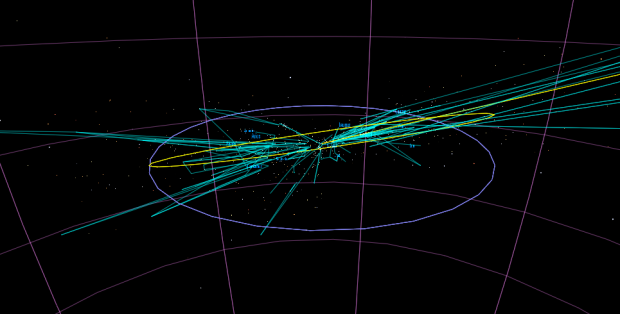
• April 17, 2012

    Topic

    Maps  /  ,

    Game developer Christopher Albeluhn found himself unemployed, so he started to work on a model of Earth in a video game engine to add to his portfolio. He finished that, and thought, hey, might as well keep on going. He eventually created the Solar System.

    Before i knew it, i had all 8 planets (I am SO sorry Pluto), the sun and the Asteroid belt. They all had correct rotations, orbits, locations and speeds; their moons, information regarding the planets and their facts. All of these were fine, but i wanted something more, so i added in the constellations, all 88 of them.

    Still though, this was portfolio work — until a link to the video went up on reddit. With some momentum, Albeluhn hopes to turn his side project into a full-fledged application. Fingers crossed for completion.

  • Brian Hayes for American Scientist discusses science publications’ roots in print and the shift towards digital.

    Print publishing has a centuries-long tradition and a rich culture. Generations of illustrators have developed technical knowledge, artistic sensibility and a highly refined toolkit. There’s a huge body of existing work to serve as example and inspiration. In digital publishing, this kind of intellectual infrastructure is only beginning to emerge.

    Yet the new computational media offer new opportunities for the exercise of creativity, especially in quantitative graphics, where illustrations are closely tied to data or mathematical functions. On the computer screen, graphs and diagrams can become animated or interactive, inviting the reader or viewer to become an explorer. I find this prospect exciting. But I’m also mindful that we don’t yet have deep experience with the new graphical methods.

  • Five and a half years ago, Netflix offered data and a $1 million prize to improve their recommendation system by at least ten percent. In 2009, a statistics team at AT&T Labs, BellKor, did that. Unfortunately, Netflix never integrated the algorithm into production.

    If you followed the Prize competition, you might be wondering what happened with the final Grand Prize ensemble that won the $1M two years later. This is a truly impressive compilation and culmination of years of work, blending hundreds of predictive models to finally cross the finish line. We evaluated some of the new methods offline but the additional accuracy gains that we measured did not seem to justify the engineering effort needed to bring them into a production environment. Also, our focus on improving Netflix personalization had shifted to the next level by then.

    That’s too bad. Netflix knows their business better than anyone, but I sure wish Keeping Up with the Kardashians wasn’t listed in my top 10 right now.

    [via Techdirt]

  • Geography graduate student Derek Watkins has some fun with population densities in an interactive version of William Bunge’s The Continents and Islands of Mankind. The above shows areas in the world where there are at least 15 people per square kilometer. In the interactive, a slider lets you shift that number up to 500 where only a few spots in the world remain.

    An interesting thing about this map is that each layer is contained in one 23,000 pixel tall spritesheet to reduce load time. An uninteresting thing is that my workflow was to export black and white density images from QGIS (which I’ve been working with more lately), generalize in Illustrator, export each slice and then stitch them together into one image with ImageMagick. I grabbed the population data from here.

    [via Derek Watkins]

  • Explore weekly earnings between men and women, over the past nine years. There’s more to say about it, but my hands are tired from manually editing parsed PDF files, so I’ll leave that for later.
    Basically, three or four articles on the gender wage gap popped up on my radar last week, some focusing on the rise of women as the lead household earner and others on how much less women make. Such contrast. So I took a look.

    Women computer support specialists rockin’ it.

  • Using hand-recorded shipping data from the Climatological Database for the World’s Oceans, history graduate student Ben Schmidt mapped a century of ocean shipping, between 1750 and 1850. The above map animates a seasonal aggregate.

    There aren’t many truly seasonal events, but a few stand out. There are regular summer voyages from Scotland to Hudson’s Bay, and from Holland up towards Spitsbergen, for example: both these appear as huge convoys moving in sync. (What were those about?) Trips around Cape Horn, on the other hand, are extremely rare in July and August. More interestingly, the winds in the Arabian sea seem to shift directions in November or so. I also really like the way this one brings across the conveyor belt nature of trade with the East.

    The bobbing month label is distracting, but its position actually does mean something. Since seasonality (i.e. weather) plays a role in travels, the label represents noontime location of the sun in Africa. Okay, I’m still not sure if that’s actually useful.

    If you really must, you can also watch the century of individual shipments during a 12-minute video.

    By the way, Schmidt used R to make this, relying heavily on the mapproj and ggplot2 packages. (Bet you didn’t see that coming.) I think he created a bunch of images and then strung them together to make the animation.

    [via Revolutions]

  • Kaiser Fung talks about the suck of overlaying plots to show a relationship.

    When the designer places two series on the same chart, he or she is implicitly saying: there is an interesting relationship between these two data sets.

    But this is not always the case. Two data sets may have little to do with each other. This is especially true if each data set shows high variability over time as in here.

    This seems to happen a lot when people take the data-to-ink ratio too literally or they’re trying too hard to be clever within a given space. Overlays work on occasion, but I can’t think of any that did off the top of my head. Most of the time it’s better to split up the layers into multiple charts.

  • In a study by TheLadders (of n equals 30), recruiters looked at resumes and make some judgments. During evaluations, eye tracking software was employed, and they found that the recruiters spent about six seconds on a resume looking for six main things: name, current company and title, previous company and title, previous position start and end dates, current position start and end dates, and education. After that, it was a crapshoot.

    Beyond these six data points, recruiters did little more than scan for keywords to match the open position, which amounted to a very cursory “pattern matching” activity. Because decisions were based mostly on the six pieces of data listed above, an individual resume’s detail and explanatory copy became filler and had little to no impact on the initial decision making. In fact, the study’s eye tracking technology shows that recruiters spent about 6 seconds on their initial “fit/no fit” decision.

    If I ever have to submit a resume, I’m just going to put those six things as bullets and then the rest will all be keywords in small, light print. It’ll be like job search SEO.

    Update: I’ve been told that TheLadder’s reputation might be less than savory, and a quick search shows some in agreement, so it might be wise to sidestep the service. Instead, go with my awesome six-bullet advice and you’re gold.

    [via @alexlundry]

  • The Washington Post asked three “young entrepreneurs” how their company uses infographics. They responded with similar sentiments. The first one said:

    Infographics can be great as part of presentations, newsletters or other research content. It keeps people’s interest by lending a storytelling and visual element to what can be sterile research.

    The second said:

    Infographics are outstanding for bringing life to content that would otherwise be dry, uninteresting or unshareable.

    And the last one, who to be fair, seems to know more than the first two, said:

    At the end of the day, the main use for infographics is to create content that can potentially go viral and drive traffic, links and exposure to a Web site and the brand.

    If I were new to these infographic things, my main takeaway here would be that they’re used to make boring material interesting. Shouldn’t it be the other way around though? Information graphics are interesting because their foundations of data and um, information are worth looking at in the first place. Don’t fall into the trap of trying to make something “visually compelling” without anything to compel with.