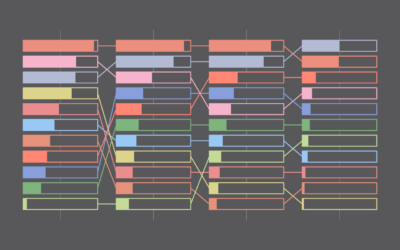
Stacked Bar Chart
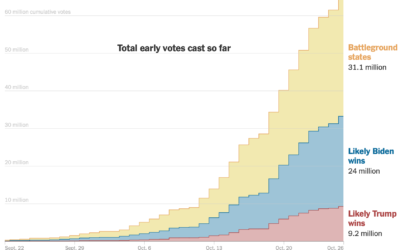
With the stacked version of the bar, compare subcategories across groups. Try not to show too many subcategories though, or it’ll clutter quick.
Commonness of Divorce in America
I wondered how common it is for someone to get a divorce. While I’ve touched on the topic before, I’ve never calculated it directly, so I gave it a go.
How Much Time We Spend Alone and With Others
Oftentimes what we're doing isn't so important as who we're spending our time with.
Social Media Usage by Age
Here's the breakdown by age for American adults in 2021, based on data from the Pew Research Center.
Fashion industry’s environmental impact
For Bloomberg, Rachael Dottle and Jackie Gu look at the current state of…
Settling all the internet debates in one go with a bunch of polling
The internet was once this fun place where people had goofy debates about…
Most Common Daily Routines
We all have our routines, but from person-to-person, the daily schedule changes a lot depending on your responsibilities.
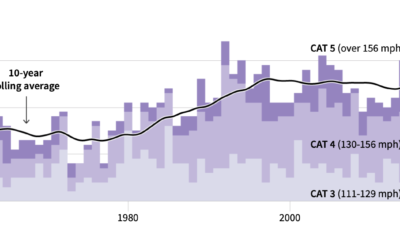
Drought extent by region
For Scientific American, Cédric Scherer and Georgios Karamanis charted drought extent by region…
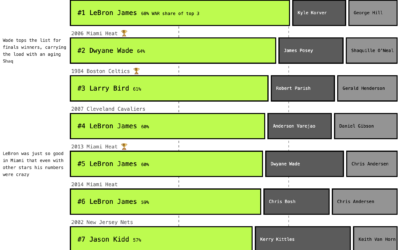
NBA carry jobs
With professional basketball, we often hear about carry jobs. There’s one star player…
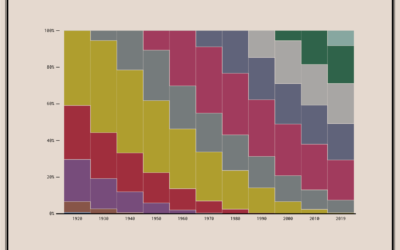
Coming and Going Age Generations
Since no one has figured out how to defeat time, age generations come and go. This chart shows the generational breakdowns since 1920.
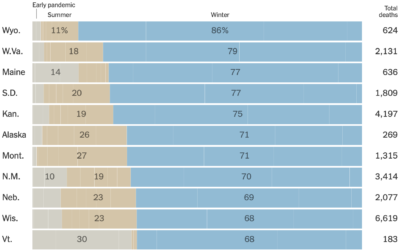
Half of coronavirus deaths were in the winter
You probably knew that coronavirus deaths have been in the several thousands per…
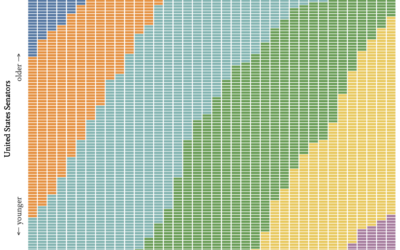
Age generations in the U.S. Senate, over time
With this straightforward unit chart, wcd.fyi shows which generation each Senate member belonged…
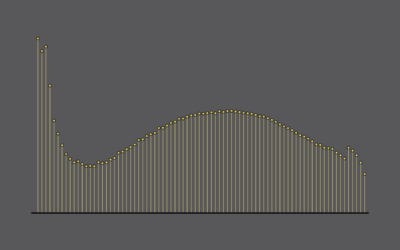
NBA Players Traded, Historical Percentages
It seems like there’s been more player movement than usual over the years. Didn’t players used to play on a single team for the entirety of their careers?
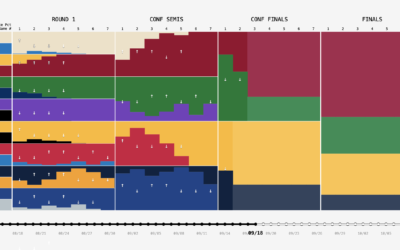
NBA playoff win probabilities, animated over time
FiveThirtyEight publishes win probabilities for NBA games throughout the season. During the playoffs,…
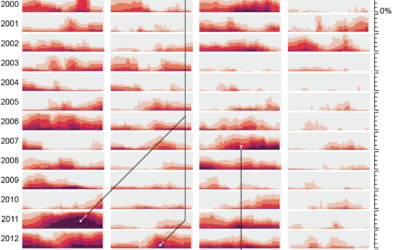
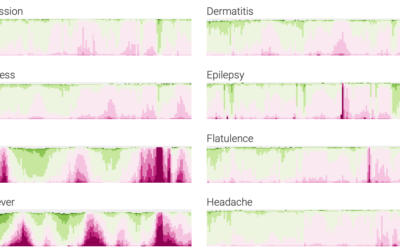
Google search trends dataset for Covid-19 symptoms
Google released a search trends dataset earlier this month. Using this dataset, Adam…
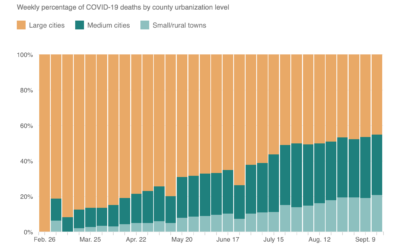
Shift of Covid-19 deaths to medium and small cities
When this all started, Covid-19 was impacting large cities at a much higher…
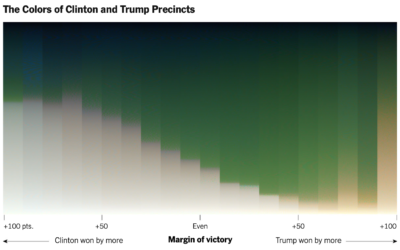
Red-blue electoral map and the green-gray in satellite imagery
For NYT’s The Upshot, Tim Wallace and Krishna Karra looked at how the…
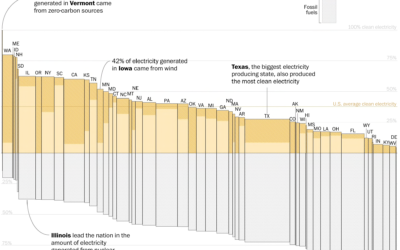
Electricity sources by state
With Joe Biden calling for 100% clean electricity, John Muyskens and Juliet Eilperin…

