NBA Players Traded, Historical Percentages

It seems like there’s been more player movement than usual over the years. LeBron James left Cleveland. Kevin Durant left OKC. James Harden wants out of Houston. Didn’t players used to play on a single team for the entirety of their careers?

No. But the percentage of players still on the team they played with their first season has been decreasing.

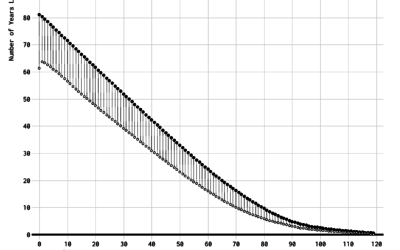
The chart below shows the percentage of players still playing for their original team and those on a different team each season.

 
The percentages are based on career stats from the NBA and only include players who played at least two seasons.

Become a member. Support an independent site. Make great charts.

See What You Get

Learn to Visualize Data See All →

How to Make a Tiled Bar Chart with D3.js

Show individual data points by splitting bars into smaller cells.

Interactive Time Series Chart with Filters

Time series charts can easily turn to spaghetti when you have multiple categories. By highlighting the ones of interest, you can direct focus and allow comparisons.

How to Make a US County Thematic Map Using Free Tools

There are about a million ways to make a choropleth map. The problem is that a lot of solutions require expensive software or have a high learning curve. It doesn’t have to be that way.

How to Make Beeswarm Plots in R to Show Distributions

Try the more element-based approach instead of your traditional histogram or boxplot.

Favorites

Peak Non-Creepy Dating Pool

Based on the “half-your-age-plus-seven” rule, the range of people you can date expands with age. Combine that with population counts and demographics, and you can find when your non-creepy dating pool peaks.

Who We Spend Time with as We Get Older

In high school, we spend most of our days with friends and immediate family. But then we get jobs, start a family, retire, and there’s a shift in who we spend our days with.

One Dataset, Visualized 25 Ways

“Let the data speak” they say. But what happens when the data rambles on and on?

Marrying Age

People get married at various ages, but there are definite trends that vary across demographic groups. What do these trends look like?