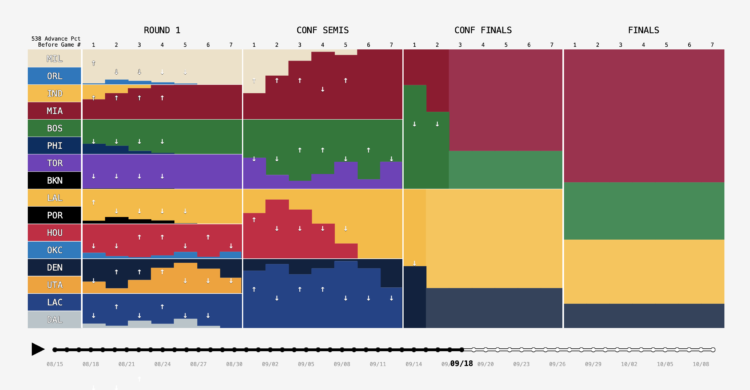
FiveThirtyEight publishes win probabilities for NBA games throughout the season. During the playoffs, they show chances of winning each round, and with each game, the probabilities shift. Adam Pearce animated these shifts, from the start of the playoffs up to now.
Nice. The visualization. Not so much the Lakers.

 Visualize This: The FlowingData Guide to Design, Visualization, and Statistics (2nd Edition)