Social Media Usage by Age

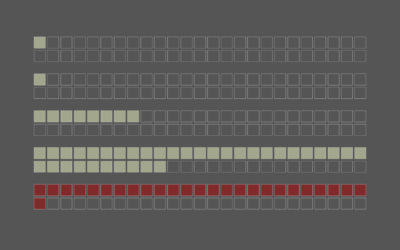
Social media apps are on a lot of phones these days, but some tend towards a younger audience and others an older. Some are common across the population. Here’s the breakdown by age for American adults in 2021, based on data from Pew Research Center.

18 TO 29 YEARS OLD

30 TO 49

50 TO 64

65 AND OLDER

84% said they used at least one social media site.

81% said they used at least one social media site.

73% said they used at least one social media site.

45% said they used at least one social media site.

0% USED IN 2021

100%

0%

100%

0%

100%

0%

100%

YouTube

YouTube

YouTube

Facebook

Instagram

Facebook

Facebook

YouTube

Facebook

Instagram

Pinterest

Pinterest

Snapchat

LinkedIn

LinkedIn

Instagram

TikTok

Pinterest

Instagram

LinkedIn

Twitter

WhatsApp

WhatsApp

WhatsApp

Reddit

Twitter

Twitter

Nextdoor

Pinterest

Snapchat

Nextdoor

Twitter

LinkedIn

TikTok

TikTok

TikTok

WhatsApp

Reddit

Snapchat

Reddit

Nextdoor

Nextdoor

Reddit

Snapchat

0%

100%

0%

100%

0%

100%

0%

100%

Source: Pew Research Center / By: FlowingData

18 TO 29 YEARS OLD

30 TO 49

50 TO 64

65 AND OLDER

84% used at least one social media site.

81% used at least one social media site.

73% used at least one social media site.

45% used at least one social media site.

USED IN 2021

0%

100%

0%

100%

0%

100%

0%

100%

YouTube

YouTube

YouTube

Facebook

Instagram

Facebook

Facebook

YouTube

Facebook

Instagram

Pinterest

Pinterest

Snapchat

LinkedIn

LinkedIn

Instagram

TikTok

Pinterest

Instagram

LinkedIn

Twitter

WhatsApp

WhatsApp

WhatsApp

Reddit

Twitter

Twitter

Nextdoor

Pinterest

Snapchat

Nextdoor

Twitter

LinkedIn

TikTok

TikTok

TikTok

WhatsApp

Reddit

Snapchat

Reddit

Nextdoor

Nextdoor

Reddit

Snapchat

0%

100%

0%

100%

0%

100%

0%

100%

Source: Pew Research Center / By: FlowingData

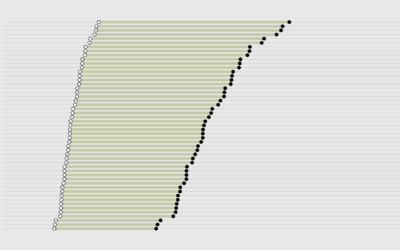
Snapchat, TikTok, and Reddit tend towards a younger audience, as you might expect. Facebook most common in the oldest group seems right. Nextdoor likely rises with home ownership, so that seems to make sense. LinkedIn relies on employment, so the bump up at middle age makes sense.

I did not expect Pinterest to rise so high in the ranks with age. Scrapbooking?

Become a member. Support an independent site. Make great charts.

See What You Get

Learn to Visualize Data See All →

How to Make Venn Diagrams in R

The usually abstract, qualitative and sometimes quantitative chart type shows relationships. You can make them in R, if you must.

How I Made That: Interactive Heatmap

Add interaction so that you can show different segments of the data and allow comparisons.

Getting Started with D3.js

Learn how to build a custom visualization using D3.js and get acquainted with the popular JavaScript library.

Build Interactive Area Charts with Filters

When you have several time series over many categories, it can be useful to show them separately rather than put it all in one graph. This is one way to do it interactively with categorical filters.

Favorites

Who is Older and Younger than You

Here’s a chart to show you how long you have until you start to feel your age.

Counting Happiness and Where it Comes From

Researchers asked 10,000 participants to list ten things that recently made them happy. I counted and connected the dots.

When Americans Reach $100k in Savings

It was reported that 1 in 6 millennials have at least $100,000 saved. Is this right? It seems high. I looked at the data to find out and then at all of the age groups.

Divorce Rates for Different Groups

We know when people usually get married. We know who never marries. Finally, it’s time to look at the other side: divorce and remarriage.