How to Make a State Grid Map in R
Something of a cross between a reference table and a map, the state grid provides equal space to each state and a semblance of the country to quickly pick out individual states.
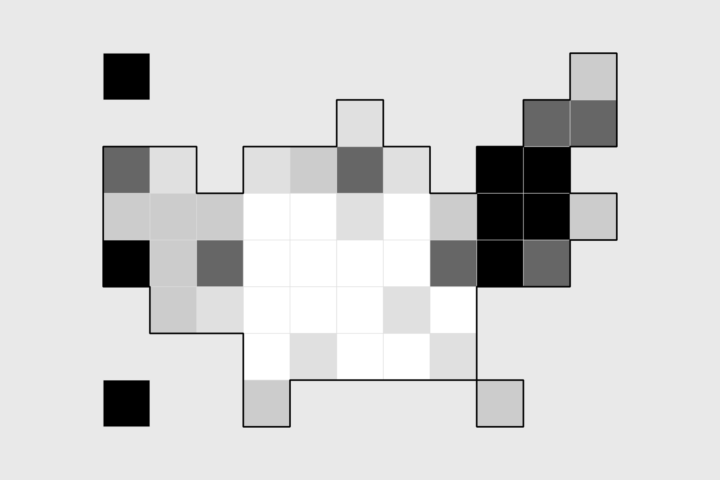
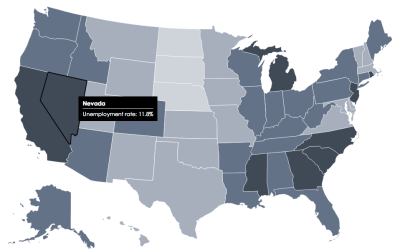
Most people recognize a state map, which makes it useful if you have state-level data. The problem is that states vary in size, so the bigger states will always take more visual space than the smaller states. Enter the grid map. Each cell represents a state and is roughly placed in the corresponding geographic location.
If you color the cells by data, you can still kind of get a sense of geographic patterns. But instead of an alternative to state choropleth map, I think of it more as an alternative for a list or a bar chart. Because of the placement, a reader can find their own state quickly and the form doesn’t take a ton of space.
To access this full tutorial, you must be a member. (If you are already a member, log in here.)
Get instant access to this tutorial and hundreds more, plus courses, guides, and additional resources.
Membership
You will get unlimited access to step-by-step visualization courses and tutorials for insight and presentation — all while supporting an independent site. Files and data are included so that you can more easily apply what you learn in your own work.
Learn to make great charts that are beautiful and useful.
Members also receive a weekly newsletter, The Process. Keep up-to-date on visualization tools, the rules, and the guidelines and how they all work together in practice.
See samples of everything you gain access to:
About the Author
Nathan Yau is a statistician who works primarily with visualization. He earned his PhD in statistics from UCLA, is the author of two best-selling books — Data Points and Visualize This — and runs FlowingData. Introvert. Likes food. Likes beer.