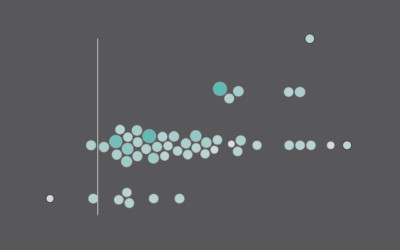
Dot Plot
A generalized form of the scatter plot, the dots can be placed in various coordinate systems.
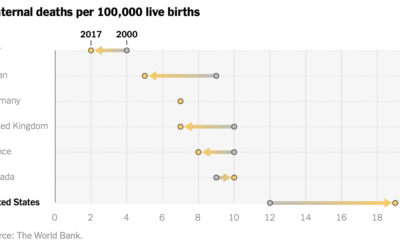
Increased maternal death in the United States
While still relatively rare, maternal mortality in the United States increased over the…
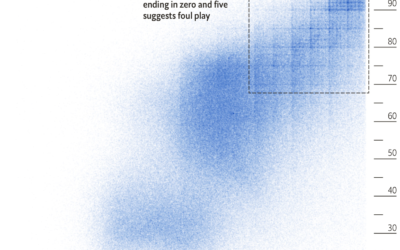
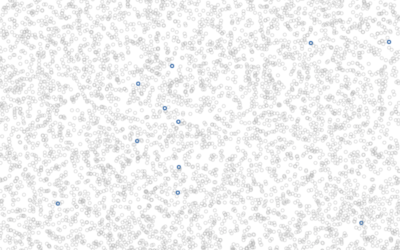
Possible cheating seen in a scatterplot
When plotting Russian election results, a structured grid patterns appear. From The Economist:…
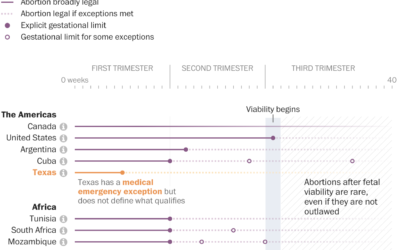
Comparing abortion limits in the U.S. against other countries
The Washington Post, in an effort that I’m sure took more energy and…
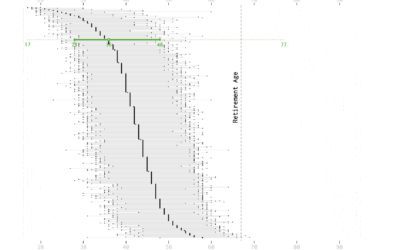
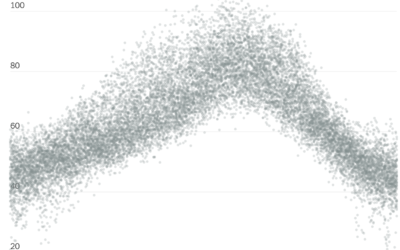
Age and Occupation
Whether it’s because of experience, physical ability, or education level, some jobs tend towards a certain age of worker more than others.

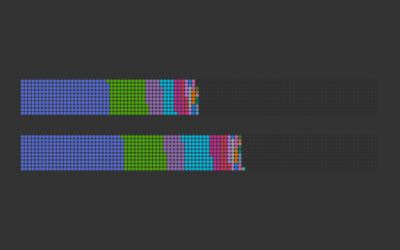
How Much More Time We Spent at Home
We had to do more from home. Here's how much everything shifted by total minutes in a day.
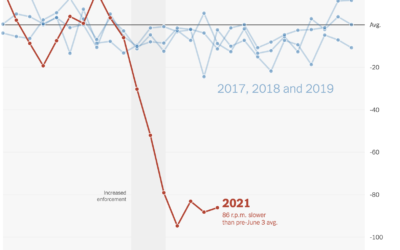
Falling spin rates in baseball after rule enforcement
NYT’s The Upshot analyzed spin rate on pitches before and after enforcing a…
Historical context for the heat in the Pacific Northwest
It’s been hot in the Pacific Northwest the past few days. NYT’s The…

Most common professional marriages
Susie Neilson for the San Francisco Chronicle compared the marriage of professions in…
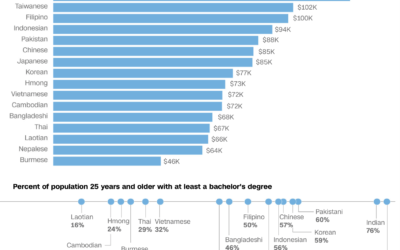
Varying demographics within the Asian American population
We often hear about the Asian American community as one big group of…
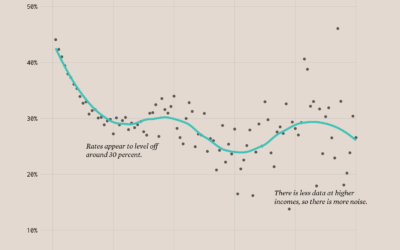
Divorce Rates and Income
Divorce rates are tied to job security, age, and occupation, so it should make sense that we see a pattern when we plot divorce rates against income.
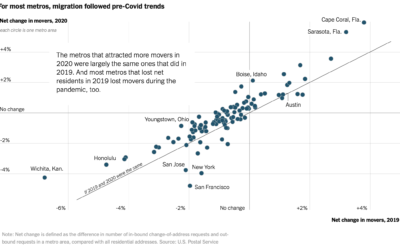
Population Growth and Seats Gained
The Census Bureau released state population counts for 2020. Here's how each state gained and lost population and seats.
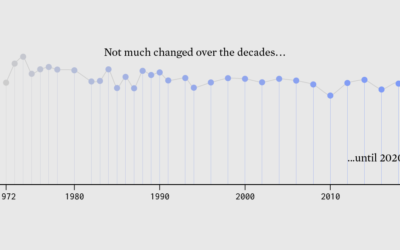
Surprise, Less Happiness During Pandemic
Since 1972, the General Social Survey has asked people about their happiness. It never changed much — until 2020 happened.
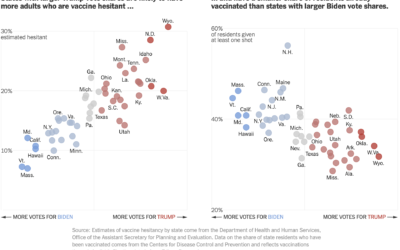
Voting and vaccination rate
Danielle Ivory, Lauren Leatherby and Robert Gebeloff for The New York looked at…
Visualizing risk of Johnson & Johnson vaccine side effect
As the Johnson & Johnson vaccine pauses in the United States, Philip Bump…
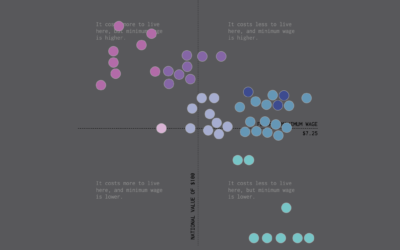
Minimum Wage and Cost of Living
We already looked at minimum wage over time, but when it comes to geography and income, you also have to consider the cost of living for a fair comparison.
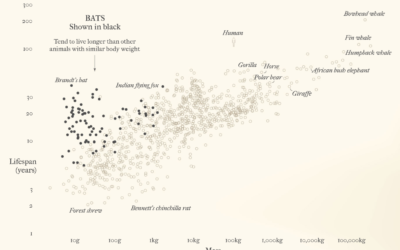
Bats and outbreaks
For Reuters, Julia Janicki and Simon Scarr, with illustrations by Catherine Tai, show…
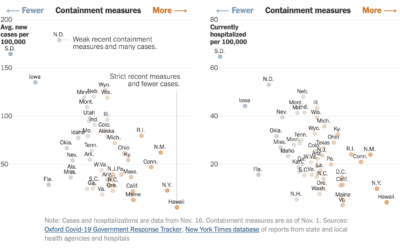
State restrictions and hospitalizations
The University of Oxford’s Blavatnik School of Government defined an index to track…