Population Growth and Seats Gained

The United States Census Bureau released state population counts for 2020, which matters because the numbers directly affect how many representatives each state gets (pointed out many times).

To gain more seats, it’s not enough for a state’s population to just increase, because most state populations are increasing. Instead, population has to grow faster in your state than in others’. Then the states are ranked based on the year’s counts, and seats are apportioned accordingly.

The chart below shows how each state faired after the new count, in terms of population growth and seats gained.


While Texas gained two seats with a 15 percent increase in population, it remains around the middle of the pack in terms of relative representation. Texas as 1.3 representatives per million people.

On the other hand, Montana gained a seat and became the most represented of all the states, relatively, with 1.8 representatives per million people. The top spot used to belong to Rhode Island, which only dropped to second, because they did not lose a seat like some expected. The bottom spot now belongs to Delaware.
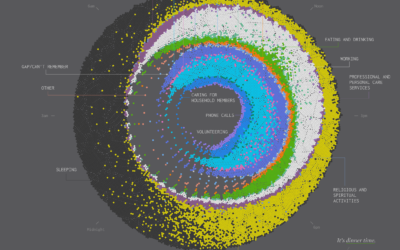
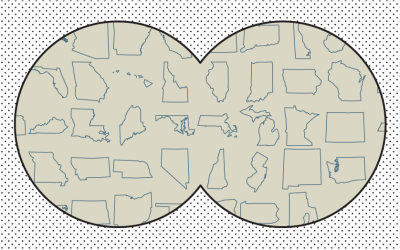
Become a member. Support an independent site. Make great charts.

See What You Get

Learn to Visualize Data See All →

How to Make an Animated Beeswarm Chart

Beeswarm charts are useful to highlight individual categories or entities. Animating them can help highlight change over time.

How to Make a Custom Stacked Area Chart in R

You could use a package, but then you couldn’t customize every single element, and where’s the fun in that?

How to Make UpSet Plots in R, with ggplot2 and ggupset

A more readable alternative to Venn diagrams for when you have more than a few sets.

How to Make Bivariate Area Charts in R

Quickly compare two time series variables with this line-area chart hybrid that originated in the 1700s. Also known as: difference chart.

Favorites

Visualizing the Uncertainty in Data

Data is an abstraction, and it’s impossible to encapsulate everything it represents in real life. So there is uncertainty. Here are ways to visualize the uncertainty.

Years You Have Left to Live, Probably

The individual data points of life are much less predictable than the average. Here’s a simulation that shows you how much time is left on the clock.

A Day in the Life: Women and Men

Using the past couple of years of data from the American Time Use Survey, I simulated a working day for men and women to see how schedules differ. Watch it play out in this animation.

A Day in the Life of Americans

I wanted to see how daily patterns emerge at the individual level and how a person’s entire day plays out. So I simulated 1,000 of them.