Surprise, Less Happiness During Pandemic
Since 1972, the General Social Survey has asked, “Taken all together, how would you say things are these days—would you say that you are very happy, pretty happy, or not too happy?” There were small blips over the decades, but 2020 was something else.
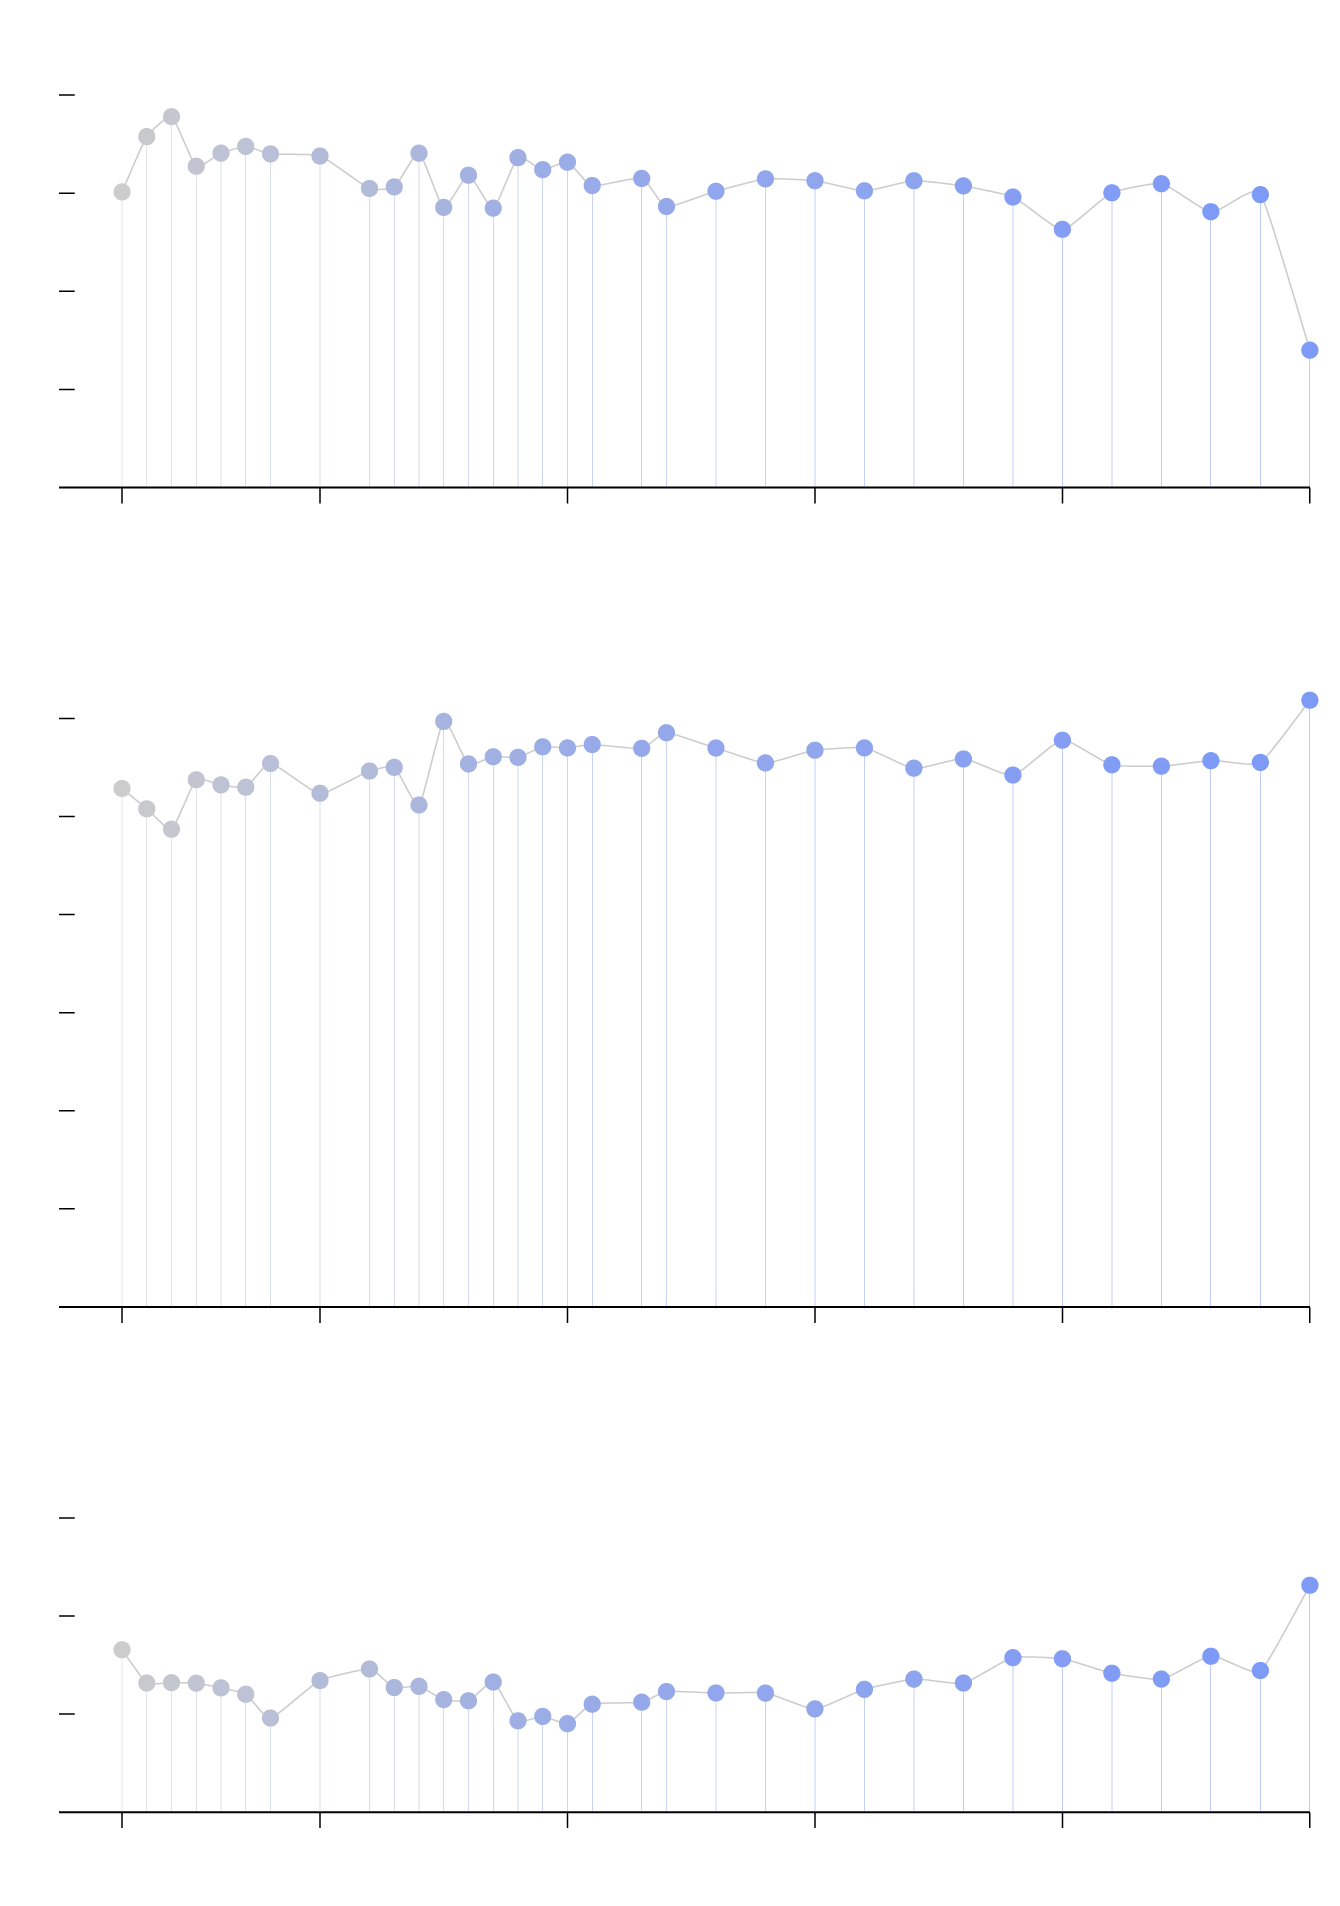
Very Happy
40%
Not much changed over the decades…
30%
20%
10%
…until 2020.
0%
1972
1980
1990
2000
2010
2020
Many still answered “pretty happy.”
Pretty Happy
60%
50%
40%
30%
20%
10%
0%
1972
1980
1990
2000
2010
2020
Not Too Happy
30%
But more people answered “not too happy” than ever before.
20%
10%
0%
1972
1980
1990
2000
2010
2020
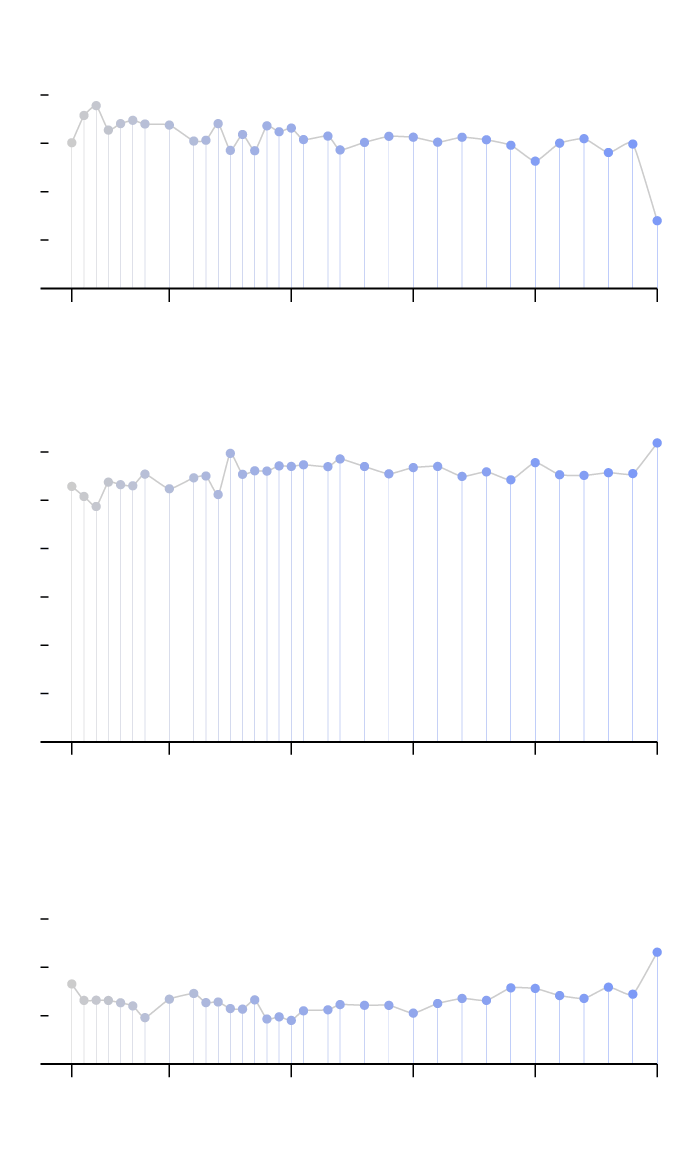
Very Happy
Not much changed over the decades…
40%
30%
20%
10%
…until 2020.
0%
1972
1980
1990
2000
2010
2020
Pretty Happy
60%
50%
Many still answered “pretty happy.”
40%
30%
20%
10%
0%
1972
1980
1990
2000
2010
2020
Not Too Happy
But more people answered “not too happy” than ever before.
30%
20%
10%
0%
1972
1980
1990
2000
2010
2020
The GSS used to release results every year, but more recently, they’ve released every two years. The 2020 results come from their COVID Response Tracking Study, since the GSS couldn’t run as usual.
Become a member. Support an independent site. Make great charts.
See What You GetFlowingData is made possible by supporting members. Since 2007, I, Nathan Yau, a real person, have been analyzing and visualizing data to help more people understand and appreciate it in their everyday lives.
If you liked this or want to make similar data things, please consider supporting this small corner of the internet. You get unlimited access to visualization courses, tutorials, and extra resources. Thanks. — Nathan
Chart Type Used
