Single Parents
In the 1950s, less than 10% of families with children were single-parent. In 2022, among families with children, 31% were single-parent — more than three times as common.
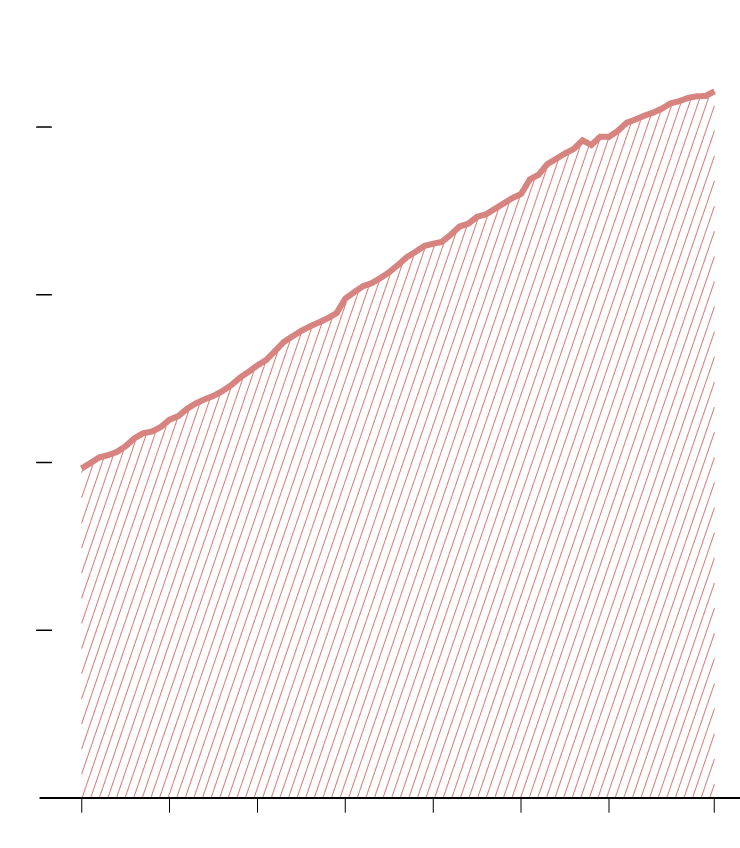
TOTAL FAMILIES
MILLIONS
80
60
40
20
0
1950
1960
1970
1980
1990
2000
2010
2022
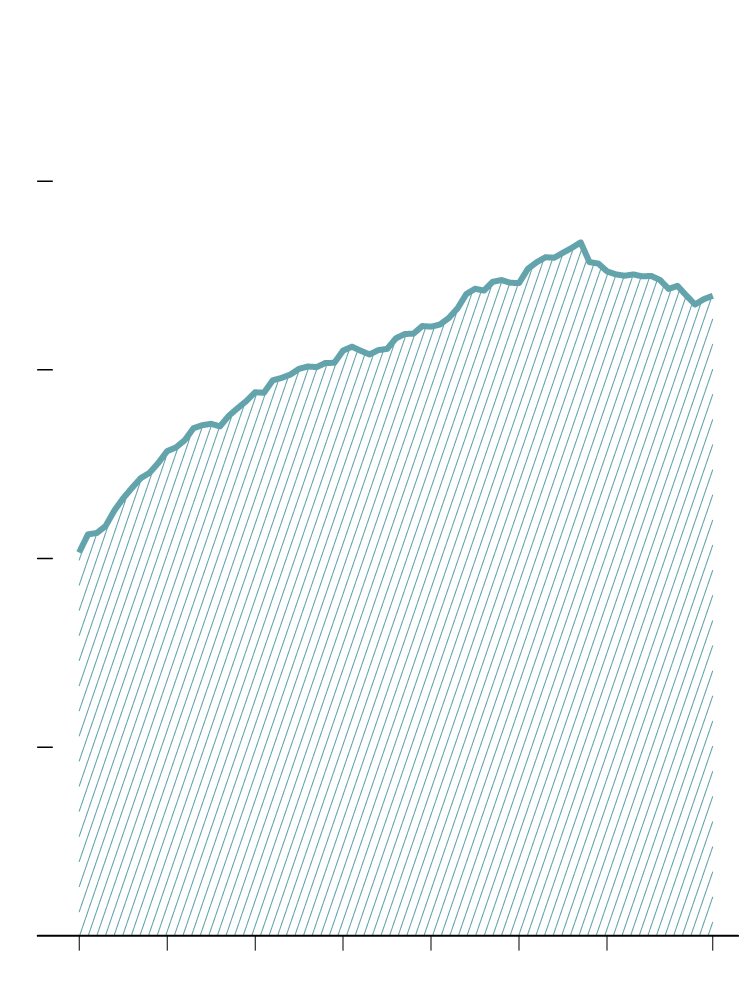
TOTAL FAMILIES WITH CHILDREN UNDER 18
MILLIONS
40
30
20
10
0
1950
1960
1970
1980
1990
2000
2010
2022
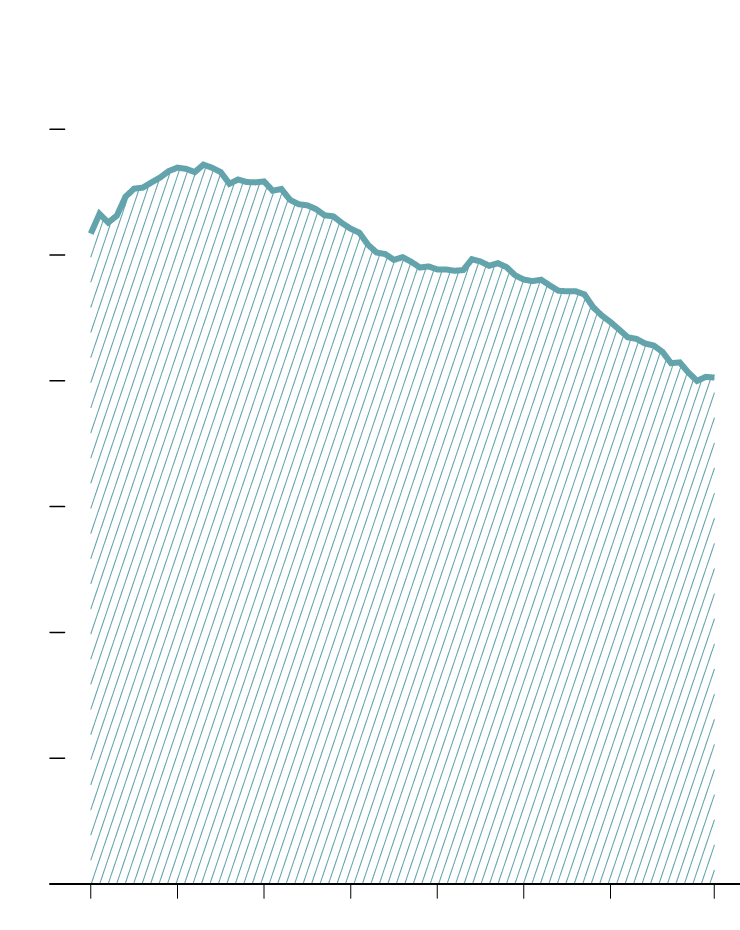
FAMILIES WITH CHILDREN UNDER 18
FROM TOTAL FAMILIES
60%
50%
40%
30%
20%
10%
0%
1950
1960
1970
1980
1990
2000
2010
2022
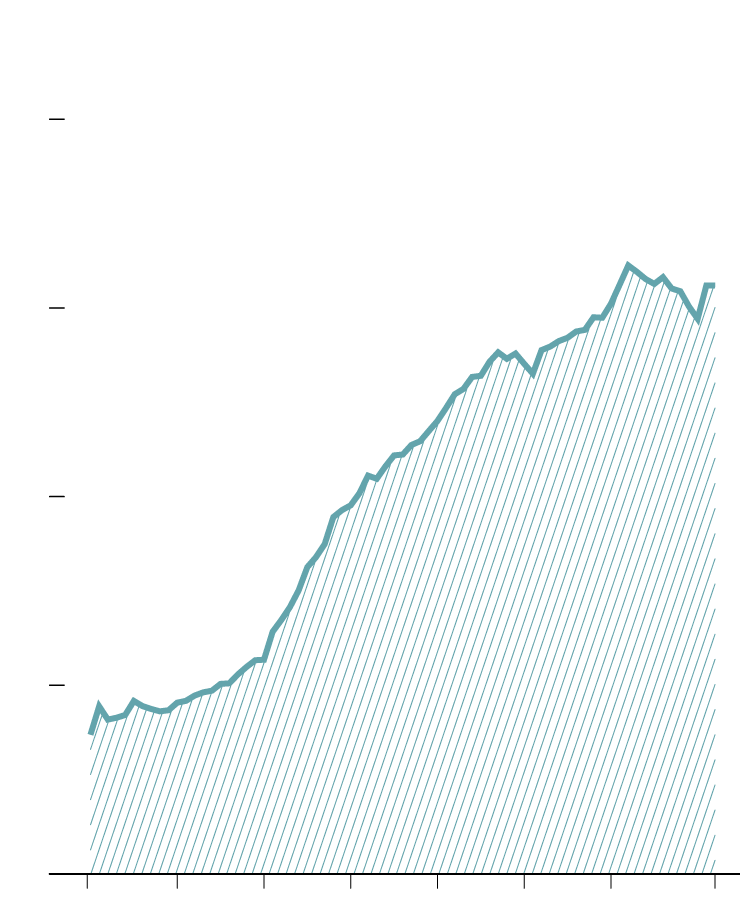
FAMILIES WITH ONE PARENT
FROM FAMILIES WITH CHILDREN
40%
30%
20%
10%
0%
1950
1960
1970
1980
1990
2000
2010
2022
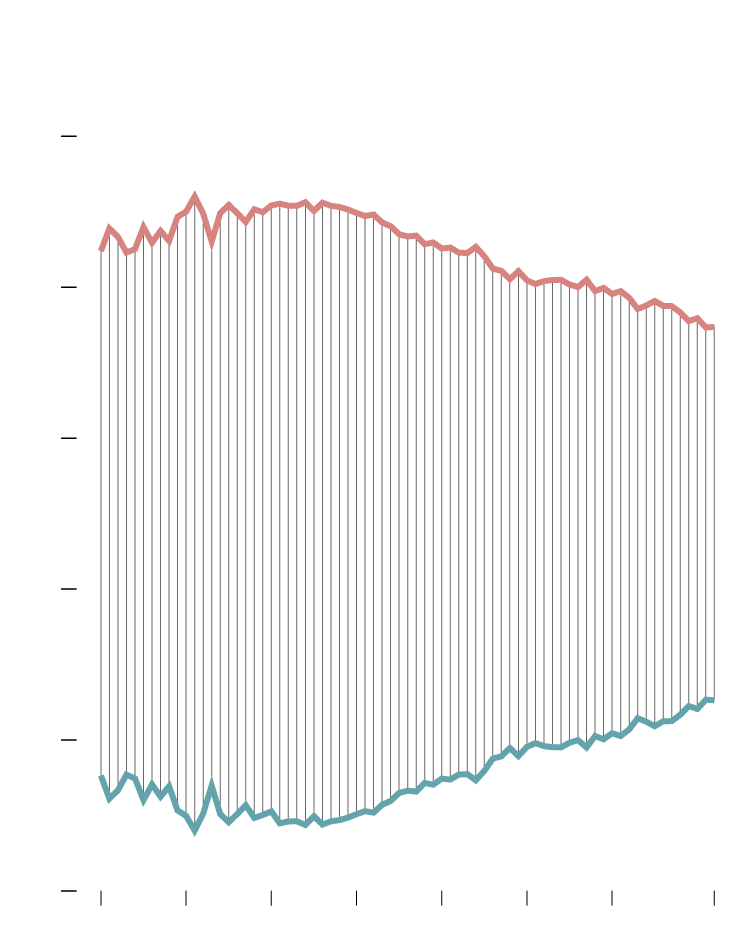
JUST MOM OR JUST DAD
FROM ONE-PARENT FAMILIES
100%
JUST MOM
80%
60%
40%
20%
JUST DAD
0%
1950
1960
1970
1980
1990
2000
2010
2022
This is based on data from the U.S. Census Bureau.
Become a member. Support an independent site. Make great charts.
See What You GetFlowingData is made possible by supporting members. Since 2007, I, Nathan Yau, a real person, have been analyzing and visualizing data to help more people understand and appreciate it in their everyday lives.
If you liked this or want to make similar data things, please consider supporting this small corner of the internet. You get unlimited access to visualization courses, tutorials, and extra resources. Thanks. — Nathan
Chart Types Used

