For Bloomberg, Rachael Dottle and Leslie Kaufman go with the combo stacked area chart and stacked bar chart on the top and bottom to show increased cost of billion dollar disasters and the counts over time. It looks like the sporadic tropical cyclones are causing the most damage.
Billion dollar natural disasters
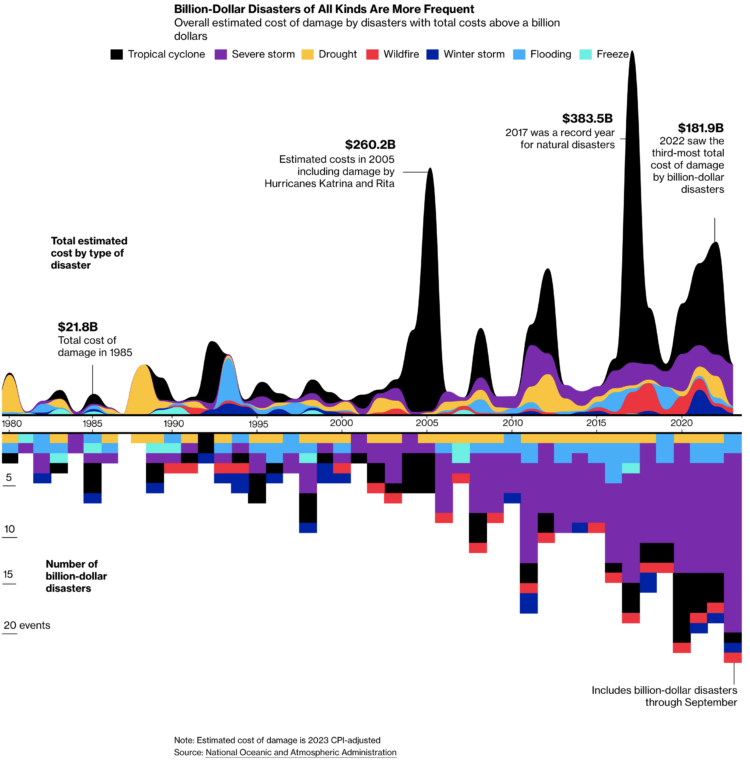
Chart Types Used


Second Edition
 Visualize This: The FlowingData Guide to Design, Visualization, and Statistics (2nd Edition)
 Visualize This: The FlowingData Guide to Design, Visualization, and Statistics (2nd Edition)
New tools, refined process.