Visualization
Showing the stories in data through statistics, design, aesthetics, and code.
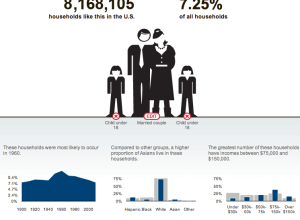
Households like yours
Accompanying an article on the changing family dynamic, The New York Times provides…
In pursuit of the American dream (house)
Trulia Insights sure has been having fun lately. In their most recent dig…
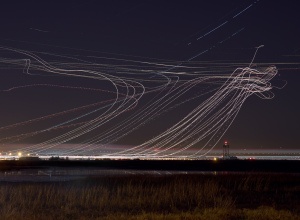
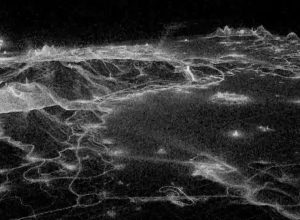
Long-exposure air traffic
Terrance Chang shows us flight patterns at San Francisco International Airport using long-exposure…

Computer assisted design and the 9/11 Memorial
Digital artist Jer Thorp discusses the algorithm and tool used to arrange 9/11…
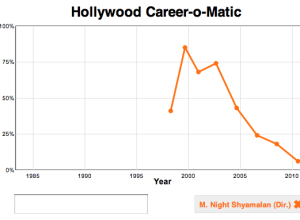
RottenTomatoes trends with Career-o-matic
Slate puts together a rough analysis of RottenTomatoes actor and director career ratings.…
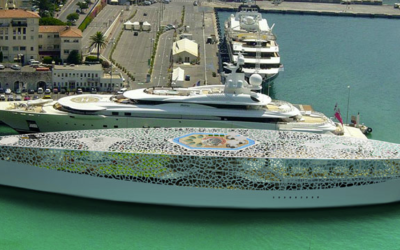
Yacht design inspired by Voronoi diagram
Industrial architect Hyun-Seok Kim, known for eccentric yacht designs, uses Voronoi diagrams as…
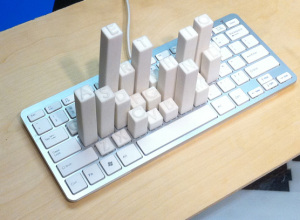
Keyboard with keys raised by frequency of use
Mike Knuepfel, a student in NYU’s Interactive Telecommunications Program, uses key frequency, according…
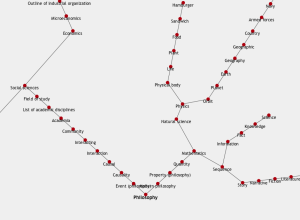
All roads lead to philosophy, on Wikipedia
Jeffrey Winter tests a hunch about links leading to philosophy on Wikipedia:
There…
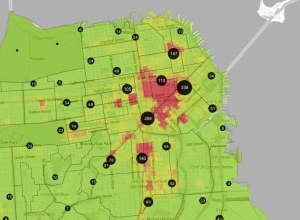
Trulia Crime Map helps you find safe living places
Real estate site Trulia made a great move when they acquired mapping outfit…
How we describe ourselves, according to online dating profiles
The traditional way to gauge who we are as a country, state, or…
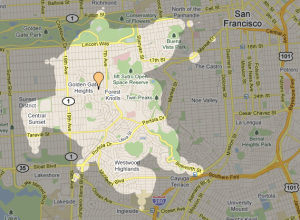
Find everywhere you can go in 15 minutes or less
A lot of the time when making plans to meet up with friends…
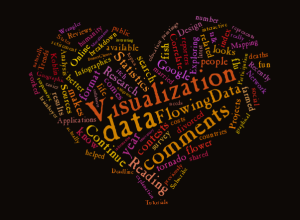
Make shaped word clouds with Tagxedo
Love ’em or hate ’em, tag clouds, or the more recent incarnation, Wordles,…
11.3m player deaths visualized in point cloud
Sometimes visualizing everything can turn out beautiful results. It seems to work especially…

Time-lapse of the night sky with the Very Large Telescope
The Very Large Telescope (VLT) in an array of four telescopes operated by…
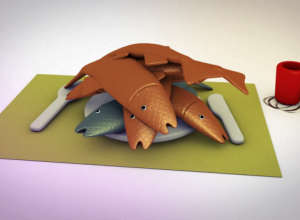
Why you shouldn’t eat farmed fish – a graphical explanation
Do you know where your fish comes from? Well, yeah, it comes from…