The last couple of Olympics, news graphics desks went with gloriously detailed explainers…
Infographics
Telling stories with data and graphics.
-
Games to test your skillz against Olympians, from your computer
-
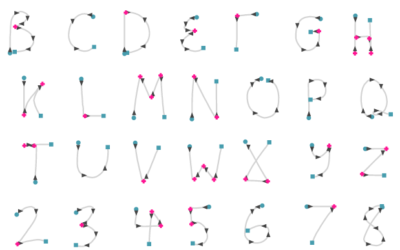
An interactive look at handwriting recognition from 1960s
In the 1960s, the RAND corporation developed a handwriting recognition system using, well,…
-
Small percentage of Americans actually picked Clinton and Trump
Alicia Parlapiano and Adam Pearce for the New York Times elegantly show a…
-
Camera really adds tens pounds
Photographic evidence.
-
Ride on the VR time series roller coaster
Speaking of virtual reality visualization, this Nasdaq roller coaster by Roger Kenny and…
-
Gun deaths
As an introduction to a series on gun deaths in America, FiveThirtyEight uses…
-
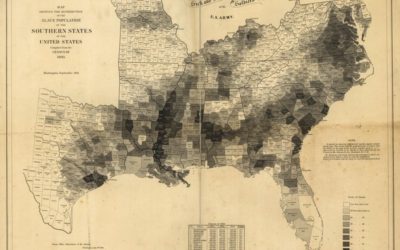
History lesson on data visualization
Clive Thompson for Smithsonian Magazine gives a quick history lesson on infographics.
[D]ata… -
What happened at Pulse in Orlando
The Tampa Bay Times takes you through a 3-D model of Pulse Nightclub…
-
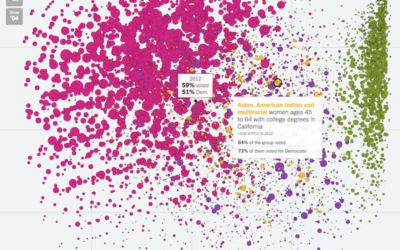
Voting habits for various demographic groups
Voter turnout and political leanings for various demographic groups play an important role…
-
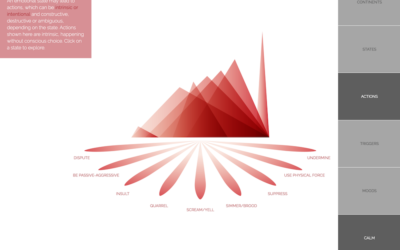
Atlas of Emotions, a collaboration with the Dalai Lama
Emotions are complex and only partially understood, yet such a force in how…
-
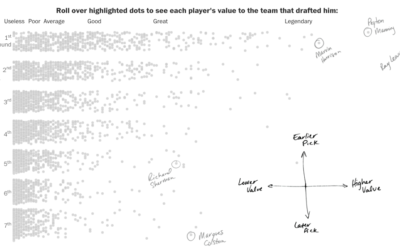
NFL draft pick quality for your team
Despite what commentators and sports analysts might have you think, picking great players…
-
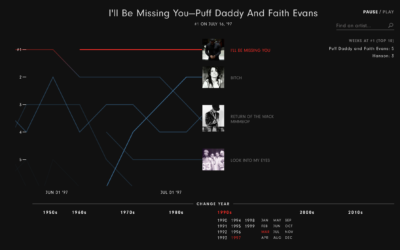
Music timeline plays through decades of top songs
The Year that Music Died from Polygraph is an animated timeline that shows…
-
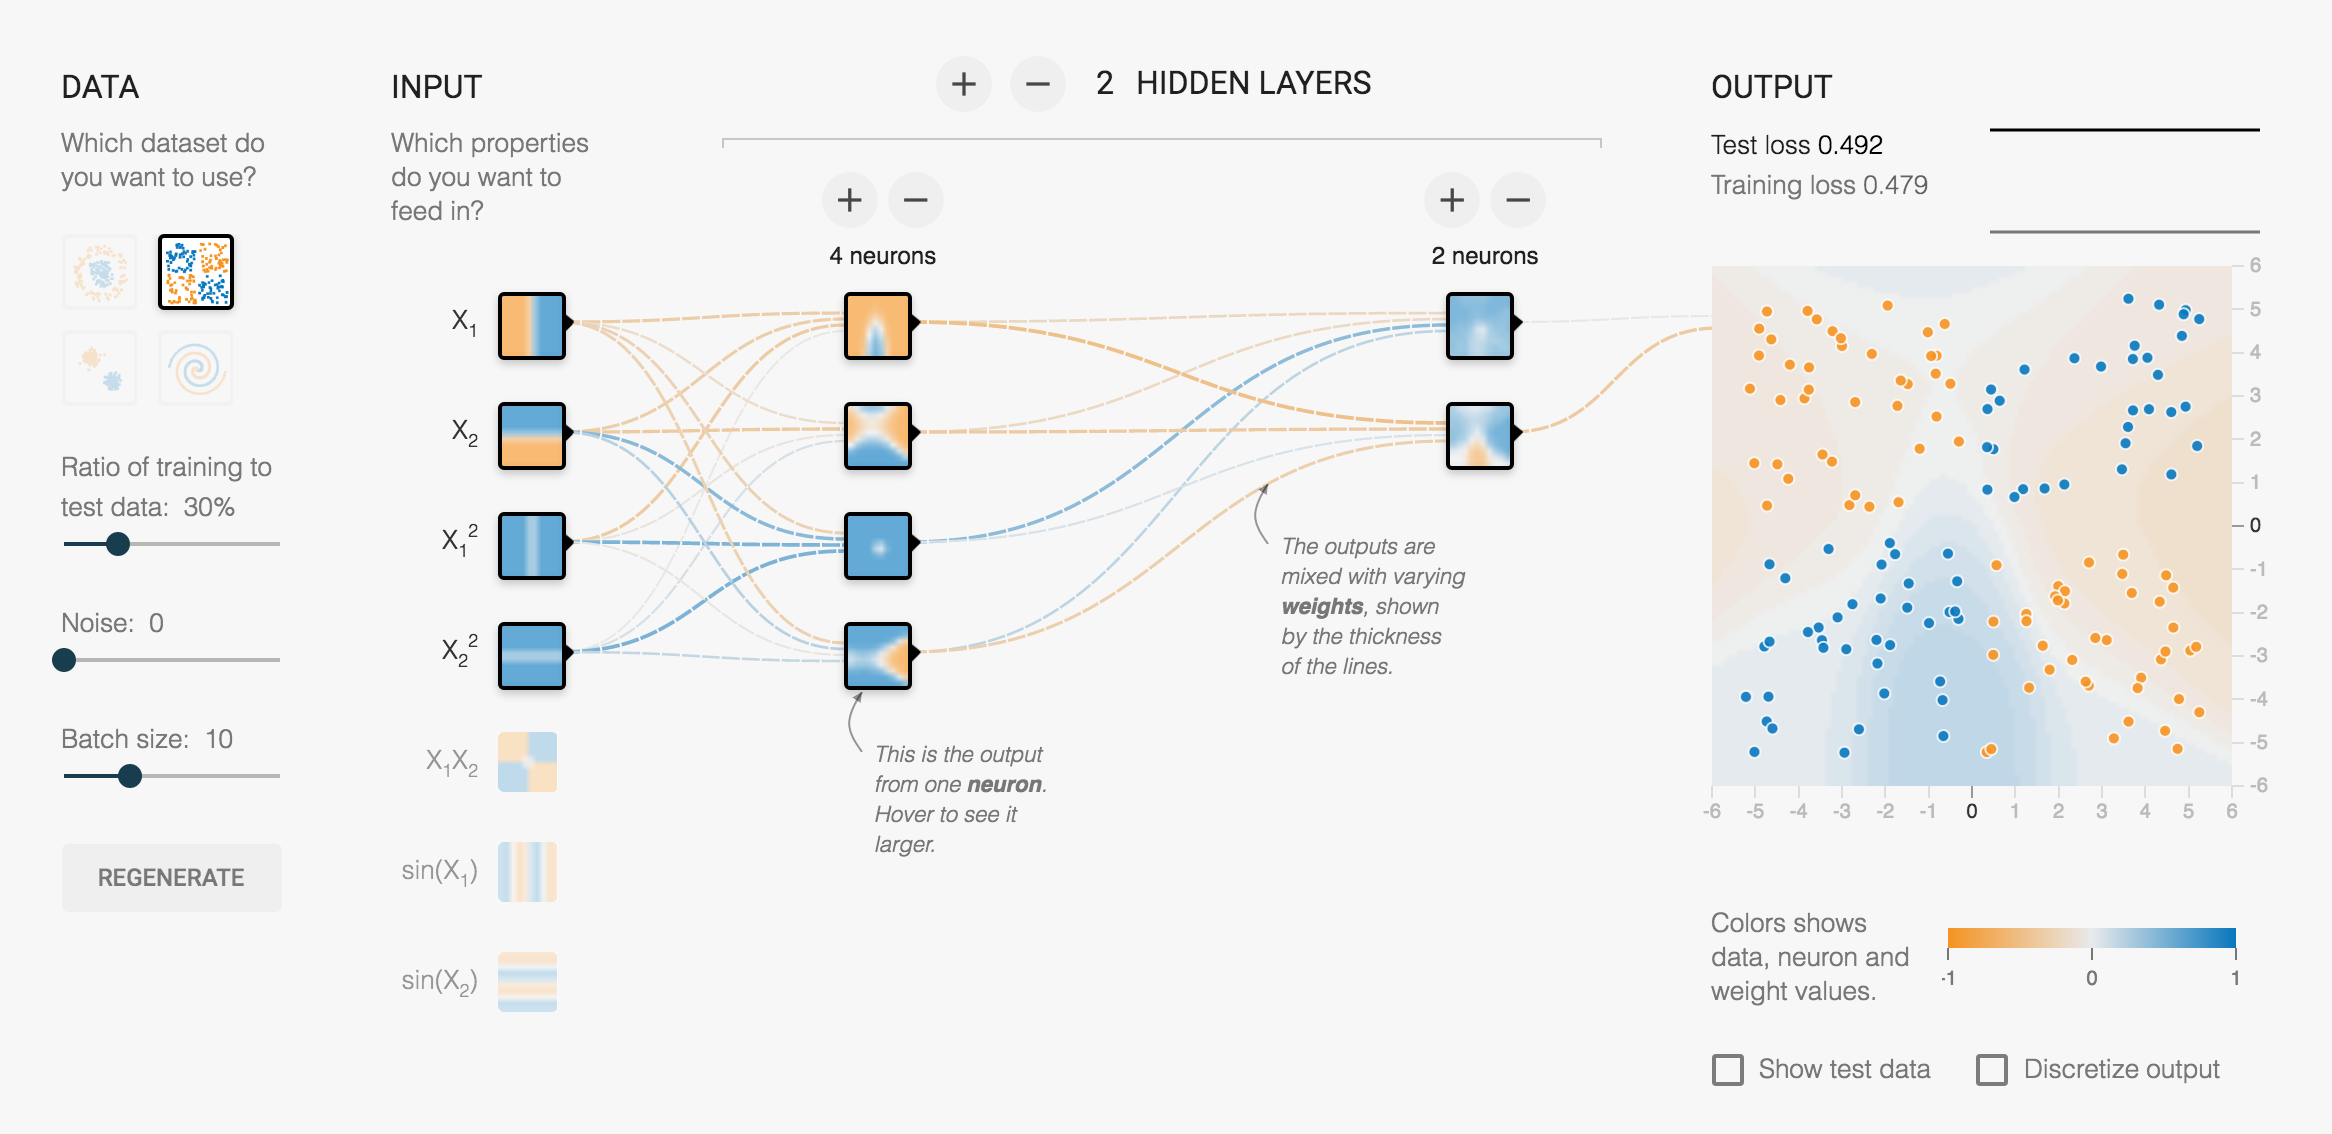
Here’s how a neural network works
Daniel Smilkov and Shan Carter at Google put together this interactive learner for…
-
Titanic sinking in real-time
Visualization of time is usually about compression so that you can see more…
-
Virus trading cards
Eleanor Lutz made some trading cards — for viruses.
To make the 3D… -
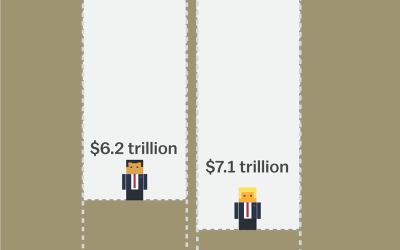
Balance the Trump and Cruz tax plans
The tax plans of Ted Cruz and Donald Trump might seem fine if…
-
Simulation shows why polls don’t always match future results
With election season in full swing, as far as the news is concerned…
-
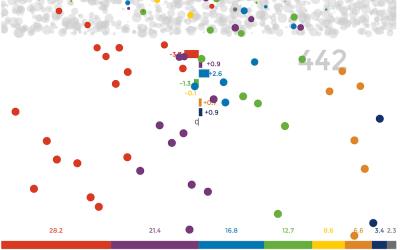
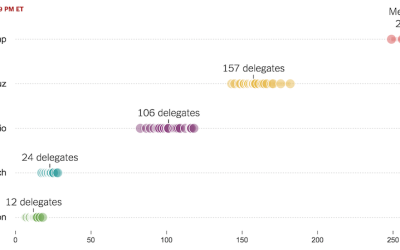
Super Tuesday simulation to show uncertainty
As we know, there are various outcomes during election season, with uncertainty in…







 Visualize This: The FlowingData Guide to Design, Visualization, and Statistics (2nd Edition)


