Clive Thompson for Smithsonian Magazine gives a quick history lesson on infographics.
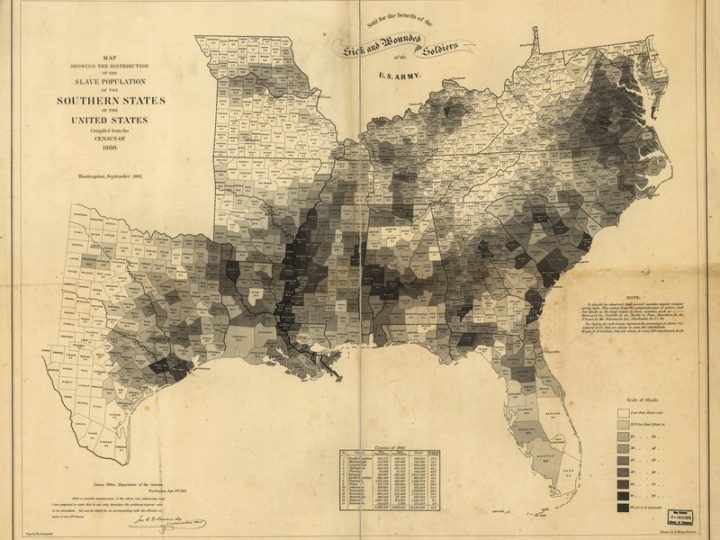
[D]ata visualization was rare because data was rare. That began to change rapidly in the early 19th century, because countries began to collect—and publish—reams of information about their weather, economic activity and population. “For the first time, you could deal with important social issues with hard facts, if you could find a way to analyze it,” says Michael Friendly, a professor of psychology at York University who studies the history of data visualization. “The age of data really began.”
Thompson uses “infographic” but really means “data visualization” most of the time, but still a good overview.
And while we’re on the topic of old visualization stuff, you should also check out Scott Klein’s newsletter, Above Chart. The history provides fine context for where visualization is at now.
 Visualize This: The FlowingData Guide to Design, Visualization, and Statistics (2nd Edition)