With the election tomorrow, Mike Bostock and Shan Carter for the New York…
Nathan Yau
-
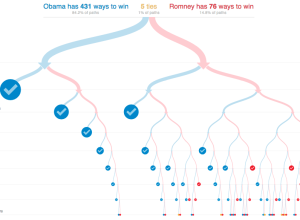
All possible paths to the White House
-
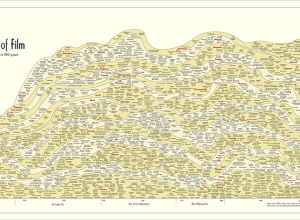
History of film, 100 years in a chart
In something of an homage to the Genealogy of Pop & Rock Music…
-
Link
Big Data Right Now: Five Trendy Open Source Technologies →
Not sure if he knows what he’s talking about but hey, R is in there
-
Link
Purists stay clear; many rules to be broken →
Honestly wouldn’t have considered some of these rules in the first place, but some good points
-
Beauty in movement
For the Made by Humans exhibit at the Hyundai Vision Hall in South…
-
A quick lesson on making predictions
Political analyst and statistician Nate Silver has gotten some flack lately for consistently…
-
Link
Watching Sandy in R →
Code to make a hurricane map [via]
-
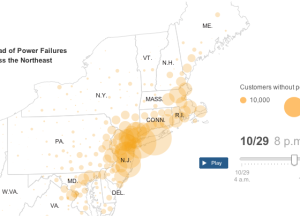
Sandy aftermath: Power outages and flooding →
The New York Times provides a detailed look at the Sandy aftermath, across…
-
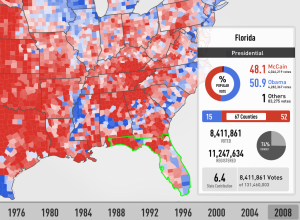
Browse elections data back to 1976 with Electionary app
Electionary, the new iPad app from TargetPoint Consulting, lets you browse national election…
-
Link
Nate Silver, Artist of Uncertainty →
From online poker to predicting elections
-
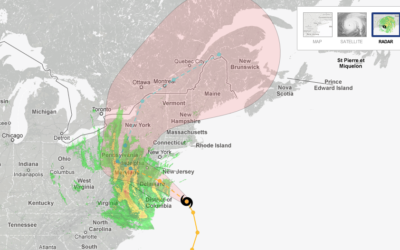
Hurricane tracker for Sandy
The New York Times has an updated version of their hurricane tracker up…
-
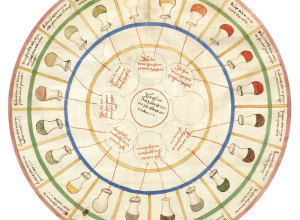
Urine wheel to diagnose disease
Some days you take a whiff it’s easy: “Yep. Definitely had asparagus last…
-
Link
GitHub Archive →
Public GitHub timeline for easy access
-
Link
Geometry simplification →
Demo by Jason Davies for simplifying geographic boundaries in D3
-
Link
Urine Wheel →
Old graphic on diagnosing metabolic diseases, based on color, smell, and taste
-
Link
Vanishing Arctic →
Art installation to show melting caps
-
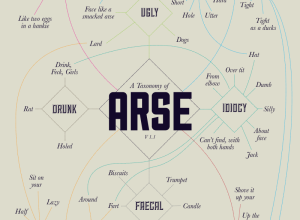
A taxonomy of arse →
By designer Stephen Wildish, a taxonomy of arse. No comment necessary.…
-
Insisting on beautiful maps
In the Atlas of Design, published by the North American Cartographic Information Society,…
-
Link
Basics of JavaScript and D3 for R Users →
From a statistician’s perspective
-
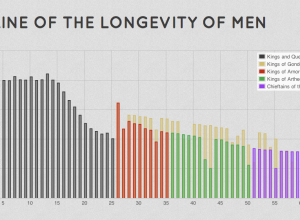
Lord of the Rings visualized
Driven by his love for Lord of the Rings, Emil Johansson explores the…
Recently for Members
Second Edition
 Visualize This: The FlowingData Guide to Design, Visualization, and Statistics (2nd Edition)
 Visualize This: The FlowingData Guide to Design, Visualization, and Statistics (2nd Edition)
New tools, refined process.
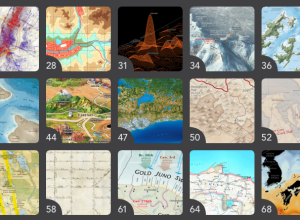
Browse by Chart Type See All →


