The steps behind making NYT map in R, showing where Rick Santorum stood before he suspended his campaign
2012
-
Link
Mapping Process →
-
A century of ocean shipping animated
Using hand-recorded shipping data from the Climatological Database for the World’s Oceans, history…
-
Link
Text Processing with MapReduce →
From Twitter engineer Jimmy Lin; free download on github
-
Link
Visualizing Twitter →
Roundup of interactives to explore tweets, retweets, and connections
-
Link
What makes good data visualization →
Discussion from a variety of fields, including my adviser
-
Link
Design is a Job →
“Work of the web designer goes well beyond pixel-pushing beautification.” Applies especially well to data designers [via]
-
Too many axes
Kaiser Fung talks about the suck of overlaying plots to show a relationship.…
-
How recruiters look at your resume
In a study by TheLadders (of n equals 30), recruiters looked at resumes…
-
How businesses approach infographics
The Washington Post asked three “young entrepreneurs” how their company uses infographics. They…
-
Link
Why Statistics? →
Seems promising, if you have access to Science
-
Link
Data Stories →
“I have a goal in life: To rid the world of bad PowerPoint slides.”
-
Link
Designing Data Visualizations →
An almost two-hour long, analytics-focused talk
-
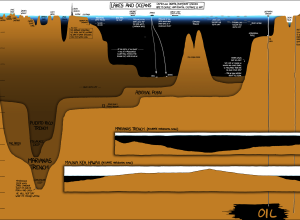
Under the Sea, Under the Sea
In usual xkcd fashion, Randall Munroe plots the depths of lakes and oceans,…
-
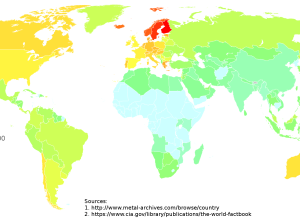
Metal bands per capita
By Reddit user depo_, this map showing metal bands per capita around the…
-
Link
geo-how-to →
Tips and tricks for making your own maps
-
Link
Manhattan-like grids in the brain →
More organized and less chaotic than previously thought
-

Conducting Demystified
The New York Times, in collaboration with the New York University Movement Lab,…
-
The Accidental Statistician
George E.P. Box, a statistician known for his body of work in time…
-
Link
Streets Visualized →
Make your own local Ben Fry-esque All Streets
-
Open thread: Are we drowning or swimming in data?
After reading another article about the flood of data that we’re drowning and…
Recently for Members
Second Edition
 Visualize This: The FlowingData Guide to Design, Visualization, and Statistics (2nd Edition)
 Visualize This: The FlowingData Guide to Design, Visualization, and Statistics (2nd Edition)
New tools, refined process.
Browse by Chart Type See All →


