On February 2 and 3, analyze money’s influence on politics
News
Conferences, workshops, contests, and the like.
-
Link
Bicoastal Datafest →
-
Researchers store petabits of data with DNA
Using DNA as a storage device, Harvard researchers managed to store one million…
-
Review of Tufte course
Thousands of people have attended Edward Tufte’s one-day course on data graphics. Robert…
-
Thoughts on the HCIL symposium
Last week I attended the 29th annual symposium at the Human-Computer Interaction Lab…
-
United Stats of America series premiere tonight
The series premiere of United Stats of America (See what they did there?)…
-
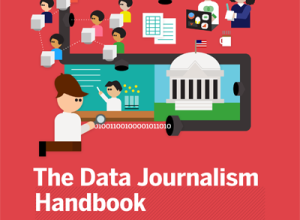
Open source Data Journalism Handbook launched
What used to be a small specialty in a few newsrooms has grown…
-
Gimme my data
We intentionally and unintentionally put data in places like Facebook and Google but…
-
Shan Carter on data storytelling
Shan Carter, who makes interactive graphics for The New York Times, talks telling…
-

Do you need a data scientist?
Cathy O’Neil on when there’s enough data to justify a data scientist in…
-
Popular Science data issue
The November issue of Popular Science is a special on data. There are…
-
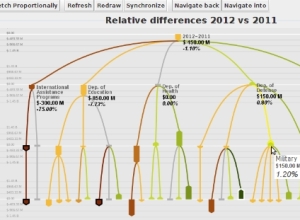
Telling Stories with Data – VisWeek 2011
Note from Nathan: Last week, visualization researchers from all over gathered in Providence,…
-

Word clouds cause death… or something
Jacob Harris, a New York Times senior software architect, rants about how people…
-

Smart people talk about art and data
A few months ago, a packed crowd gathered in Minneapolis for the Eyeo…
-
Data-ish job openings
If you’re good with data and looking for a job, you’re in luck.…
-
Strata data conference: Last day for early bird registration + 20% off
Following the success of the Strata conference earlier this year here on the…
-

Data Scientist: The hottest job you haven’t heard of
Maryalene LaPonsie describes some novel job called Data Scientist (although we’ve known about…
-
Comparing current data boom to past waves
Pete Warden, for O’Reilly Radar, compares current data responsibilities with those of harbor…
-

Data tales, revolution, and journalism
On the Media’s episode last week was on data, namely personal data collection,…
-
Growing need for data heads
The New York Times, citing a number of bits from a recent McKinsey…
-

Ben Fry on visualization future and data literacy
Ben Fry, co-creator of Processing and head of Fathom Design, talks data visualization…
Recently for Members
Second Edition
 Visualize This: The FlowingData Guide to Design, Visualization, and Statistics (2nd Edition)
 Visualize This: The FlowingData Guide to Design, Visualization, and Statistics (2nd Edition)
New tools, refined process.
Browse by Chart Type See All →


