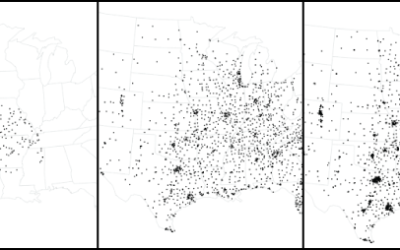
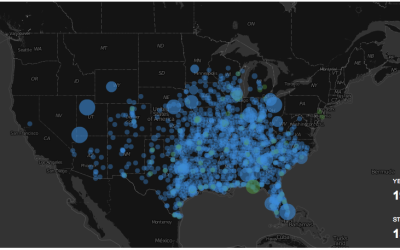
Although time series plots and small multiples can go a long way, animation can make your data feel more real and relatable. Here is how to do it in R via the animated GIF route.
Walmart
-
Members Only
How to Make an Animated Growth Map in R
-
Watching the Growth of Walmart
The ever so popular Walmart growth map gets an update, and yes, it still looks like a wildfire. Sam’s Club follows soon after, although not nearly as vigorously.


 Visualize This: The FlowingData Guide to Design, Visualization, and Statistics (2nd Edition)


