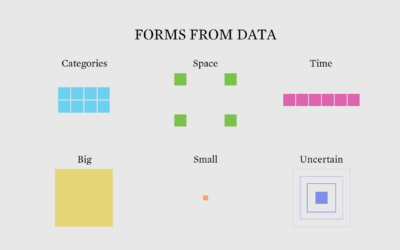
This is the 300th weekly issue of The Process. Have things changed? Do we visualize data differently now? Where is this headed?
practice
-
Members Only
Shifting Visualization Process, 300
-
Members Only
Chart Practice: Branch Out Beyond the Visual Bits
Learn more about your data and have more to visualize.
-
Members Only
Chart Practice: Changing the Audience
Learn about who is looking at your work and how they interpret it.
-
Members Only
Chart Practice: Feature Focus
Focus on the small visualization things you can improve while still getting your work done.
-
Members Only
Chart Practice: Switching the Datasets
Same data brings out the same visual forms. So switch up the data that you look at.
-
Members Only
Chart Practice: Mimicking Others
One of the most straightforward ways to “do the thing” — and stay on the right track towards work you want to do — is to mimic projects that you like.
-
Members Only
Chart Practice
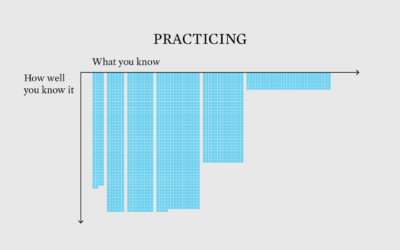
Split it up into small pieces and then aim for depth.
-
Chart Challenge for a Day
My schedule doesn’t really fit with the daily-thing-for-thirty-days genre of challenges. So my genius idea was to compress a 30-day challenge into one day.
-
Members Only
Develop Your Judgement
While some parts of visualization are formulaic, outside variables require that you adjust.
-
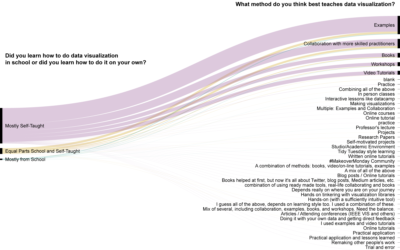
How practitioners learned data visualization
Visualization is still a relatively young field, so people learn about and how…
-
Members Only
Repetitions, Data Analysis as Brainstorm
Compelling visualization doesn’t just conjure itself out of nowhere. The ideas come from somewhere, and oftentimes they build off previous ones.


 Visualize This: The FlowingData Guide to Design, Visualization, and Statistics (2nd Edition)


