Defaults are generalizations to fit many datasets, which means you usually get barebone charts. For analysis, all well and good. However, data graphics for presentation require more care after the initial output.
custom
-
Members Only
Better than Default
-
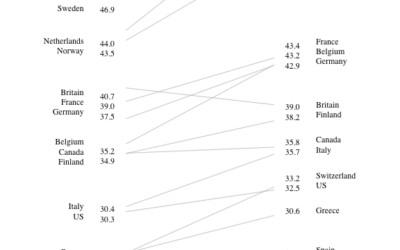
Tufte style charts in R
Lukasz Piwek is chipping away at a collection of Tufte-style charts using R,…
-
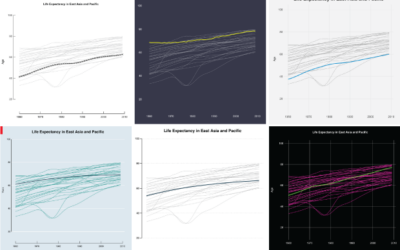
Moving Past Default R Charts
Customizing your charts doesn’t have to be a time-intensive process. With just a teeny bit more effort, you can get something that fits your needs.
-
Members Only
How to Draw in R and Make Custom Plots
When base graphics and existing packages don’t do it for you, turn to low-level graphics functions to make what you want.
-
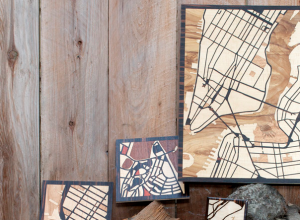
Custom Woodcut Maps
Just choose the location you want via the Google Maps interface, pick what…

 Visualize This: The FlowingData Guide to Design, Visualization, and Statistics (2nd Edition)


