Filled contour plots are useful for looking at density across two dimensions and are often used to visualize geographic data. It’s straightforward to make them in R — once you get your data in the right format, that is.
contour map
-
Members Only
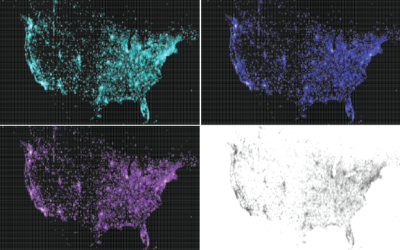
How to Make a Contour Map
Recently for Members
Second Edition
 Visualize This: The FlowingData Guide to Design, Visualization, and Statistics (2nd Edition)
 Visualize This: The FlowingData Guide to Design, Visualization, and Statistics (2nd Edition)
New tools, refined process.
Browse by Chart Type See All →


