This week we look at connecting multiple charts explicitly and implicitly to provide a cohesive narrative or visual metaphor around a dataset.
connections
-
Members Only
Connect the Charts
-
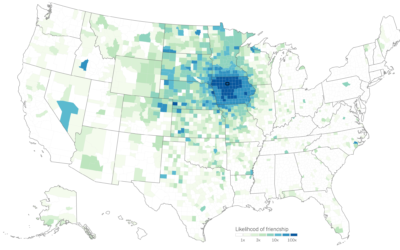
Judging connectedness of American communities, based on Facebook friendships
We talk about geographic bubbles a lot these days. Some areas are isolated,…
-
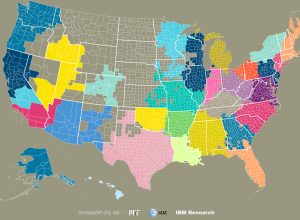
Community connections via SMS and phone call data
We often think of communities in the framework of government-set boundaries, but relationships…


 Visualize This: The FlowingData Guide to Design, Visualization, and Statistics (2nd Edition)


