One of the best ways to learn how to visualize data is to recreate a chart, but sometimes it’s unclear how that chart got made. What tool was used? What are the steps to make the chart with your own tools?
components
-
Members Only
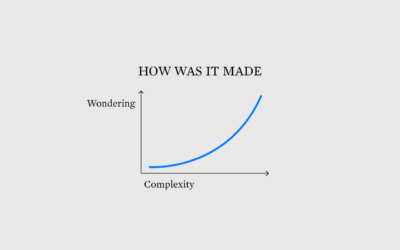
Figuring Out How a Visualization Was Made
-
Members Only
No Data, Chart Dies
If the charts themselves are fairly straightforward without any dubious design choices, are you still “lying with charts” when only the data itself was manipulated?
-
Constructing charts and graphs
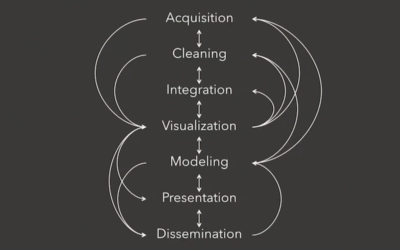
Jeffrey Heer, a computer science professor at the University of Washington, provides an…
-
Members Only
Chart Components and Working On Your Graphics Piece-wise
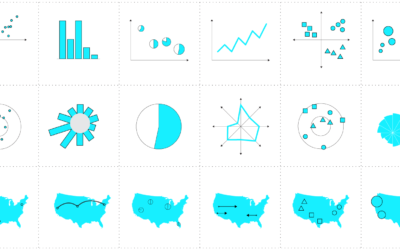
Break the visualization into its basic pieces to make it easier to make, edit, and reuse.


 Visualize This: The FlowingData Guide to Design, Visualization, and Statistics (2nd Edition)


