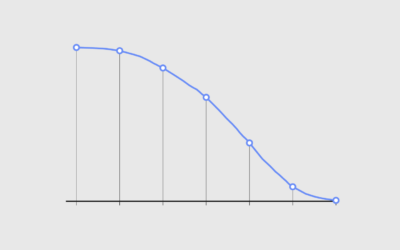
Line Chart
Typically used to show trends over time, the slope of the line between two points shows patterns of change.
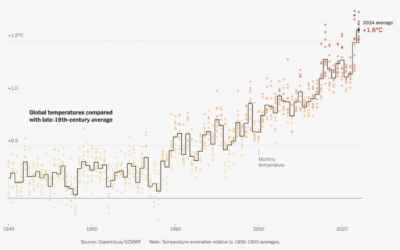
Earth was hotter than ever, again
This is some good step charting by Mira Rojanasakul for the New York…
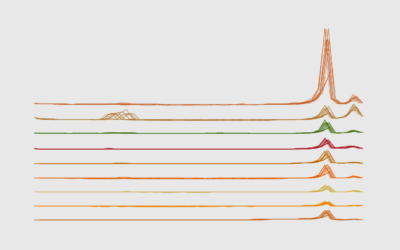
Peak Thanksgiving Food
One of the highlights of Thanksgiving in the United States is the food, as seen through the lens of Google Trends.
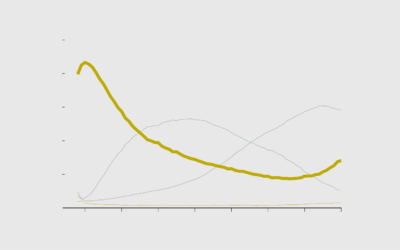
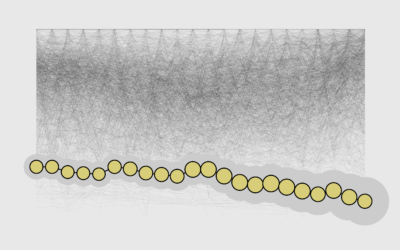
Make the Chart: Interactive Line Chart with Ghost Trails
Using faded lines to show the overall changes in a time series and to provide a point of reference for the present.
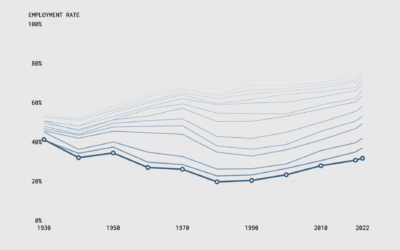
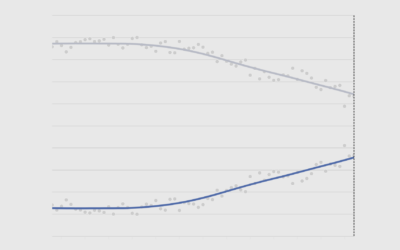
Employment Rates and Age, More Work and More Years
We can see the changing scales of who works and for how long through employment rates by age and time.
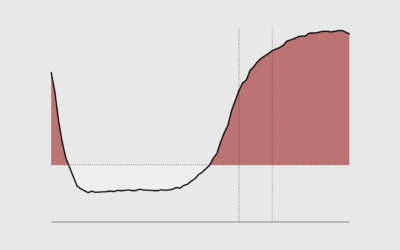
When Americans Stop Working
Normal retirement age, also known as full retirement age, is 67 years old for those born in 1960 or later. It's common for people to stop working before this age, but they're veering older.
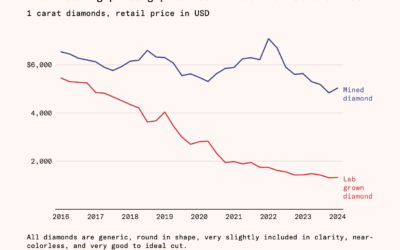
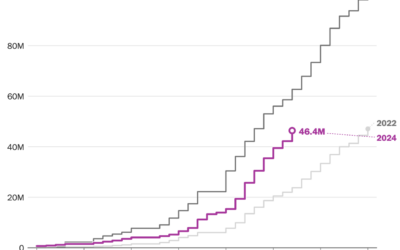
Falling cost of lab-grown diamonds
Natural diamonds require a lot of pressure and time, and then someone has…
Focusing Off Defaults
Default visualization settings are useful when it's just you analyzing data. However, visual focus is better when it's time to present.
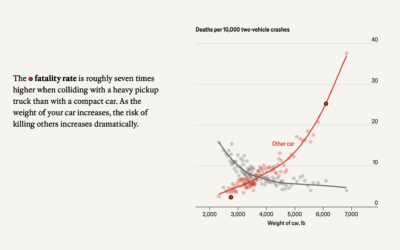
Weight of cars and fatalities
The Economist examines car weight and fatalities in car crashes. In two-vehicle collisions,…
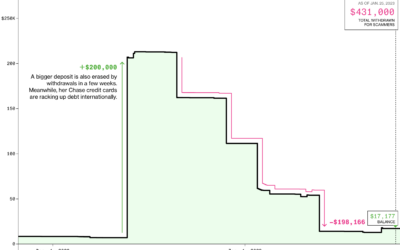
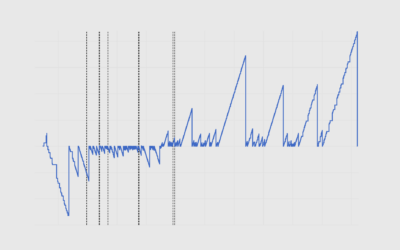
Scammed out of life savings, a line chart
Annette Manes, a retired widow and single mother who saved by spending little,…
When Working Gets Harder With Age
Difficulties increase steadily over the years, but if we're lucky enough to reach our 80s, there appears to be a steeper drop.
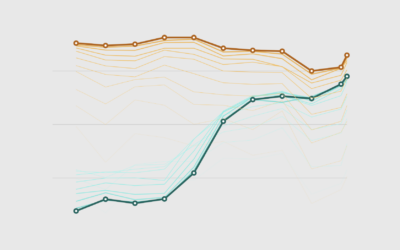
Changing Difficulty of Getting Into Your College, Past Two Decades
It's gotten more difficult to get into top colleges over the years, but most schools have either admitted students at the same rate or increased admission rates since 2001.
Decade-Long Battle for “Yogurt” vs. “Yoghurt” on Wikipedia
After years of enthusiastic discussions, editors eventually and begrudgingly came to a conclusion.
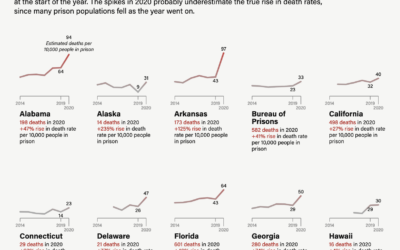
Rise in prison death rates during the pandemic
The Marshall Project highlights research on excess mortality in U.S. prisons:
The slowdown…
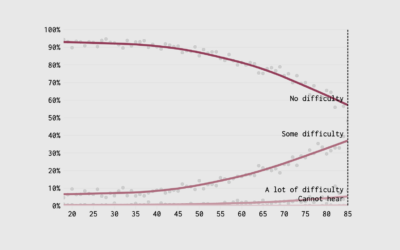
When Your Vision and Hearing Decline with Age
Find out when it's your time for the glasses and hearing aid. Time is undefeated.
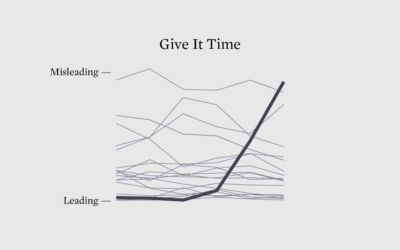
Misleading or Not? A Chart About How Couples Meet
If a chart is seen by enough people, someone will call it misleading. There are no exceptions.
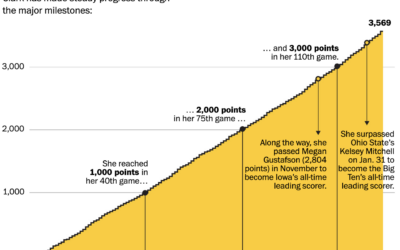
Rise of Caitlin Clark, scoring machine
Caitlin Clark, a basketball guard for the University of Iowa, has been steadily…
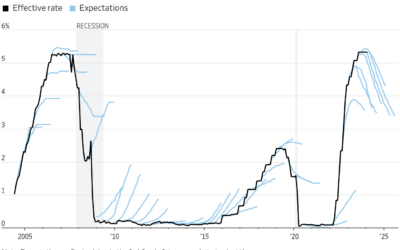
Investor expectations for interest rates compared to reality
This chart by Eric Wallerstein for the Wall Street Journal shows expectations against…