Visualization
Showing the stories in data through statistics, design, aesthetics, and code.
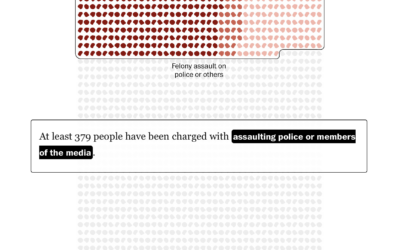
January 6 defendants, a breakdown
1,580 people were charged with federal crimes for the riot at the U.S.…
Tracking the effects of Congestion Pricing in New York
In an effort to reduce traffic, New York launched a program that charges…


Best Data Visualization Projects of 2024
Many datasets were analyzed and many charts were made this year. These are my favorite data visualization projects from 2024.
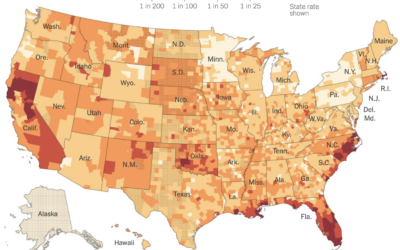
Home insurance companies dropping customers
Because of a warming planet with more wildfires and hurricanes, it’s growing more…
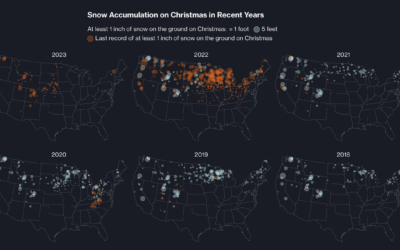
When cities last saw snow on Christmas
Christmas is coming. For some, that means snow on the ground, but as…

Data Advent Calendar
Jordan Cunliffe uses embroidery to explore and visualize data. This year, headed towards…
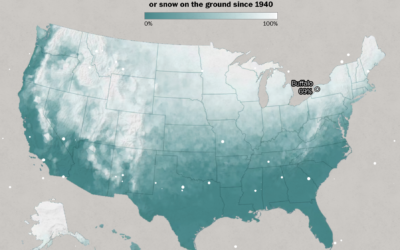
Counting the Christmas days with snow
This is a fun one by Dylan Moriarty for the Washington Post. Punch…
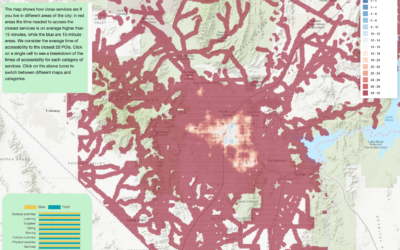
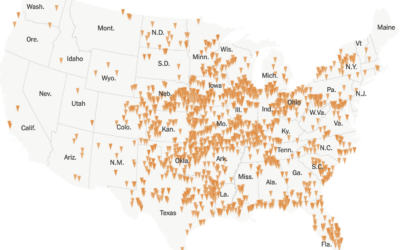
Map of walkable neighborhoods
Researchers at Sony Computer Science Laboratories in Rome estimated the time it takes…
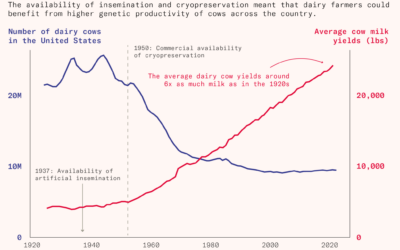
More milk, fewer cows
For Works in Progress, Jared Hutchins explains how milk production increased per cow,…
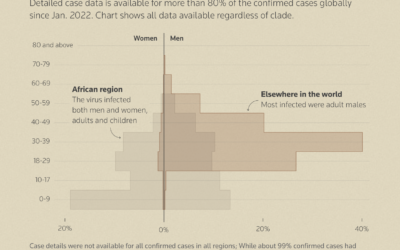
How mpox virus spreads
For Reuters, Arathy J Aluckal, Jitesh Chowdhury, and Vijdan Mohammad Kawoosa illustrate how…
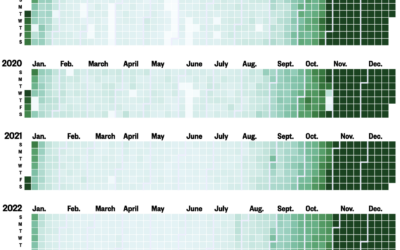
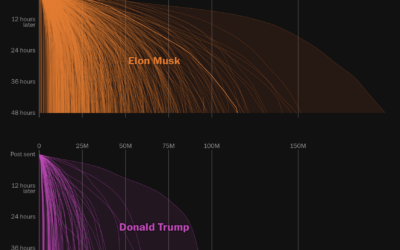
“All I Want for Christmas Is You” spreads to earlier months
For NBC News, Joe Murphy shows the play rate on Last.fm for Mariah…
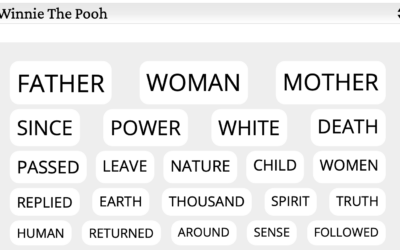
Words that do not appear in literature
Word clouds show key terms or phrases that appear in a body of…
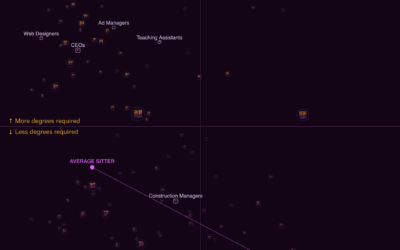
Sitting vs. standing jobs
Some jobs require a lot of standing, crouching, and climbing, whereas other jobs…