Visualization
Showing the stories in data through statistics, design, aesthetics, and code.
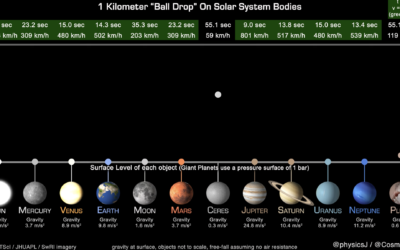
How long it takes a ball to drop on various Solar System bodies
James O’Donoghue made this straightforward animation that shows how long it takes for…
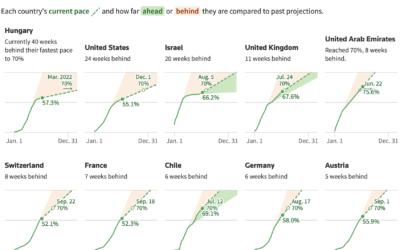
Slowing and then renewed interest in getting vaccinated
When countries gained access to vaccines, there was an initial burst of vaccinations,…
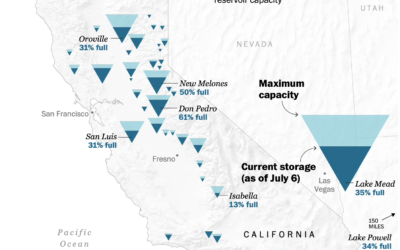
Map of drying reservoirs in the west
To show water levels in California’s drying reservoirs, The Washington Post used upside…
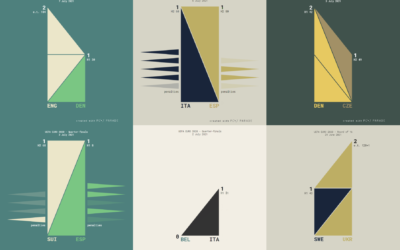
UEFA Euro 2020 matches visualized with triangle sets
Krisztina Szűcs used sets of animated triangles to show how each match played…
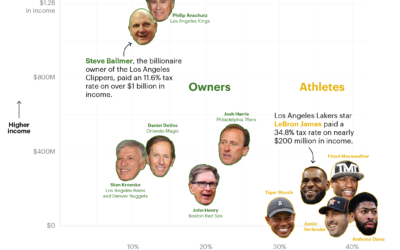
How sports owners pay less taxes than athletes
ProPublica continues their analysis of an anonymous dump of tax records, this time…
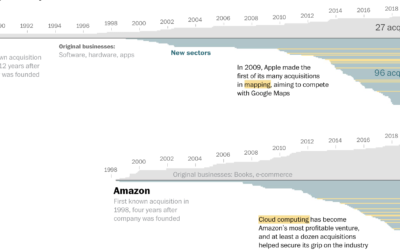
How big tech grew by acquiring small tech
Big tech — Amazon, Apple, Google, and Facebook — got big and then…
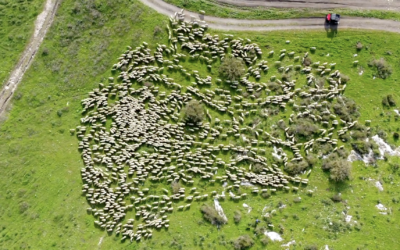
Sheep herding movements from above
Aerial photographer Lior Patel followed a herd of sheep in Yokneam. The results…
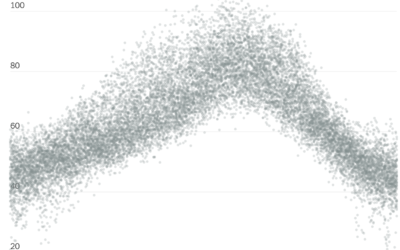
Historical context for the heat in the Pacific Northwest
It’s been hot in the Pacific Northwest the past few days. NYT’s The…
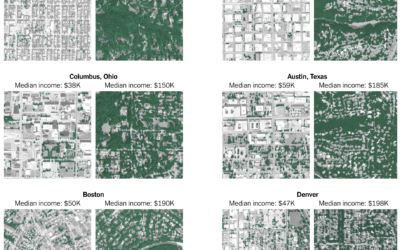
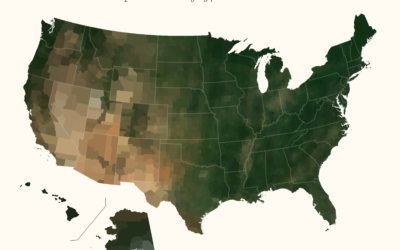
Average color of geographic areas
Based on satellite imagery, Erin Davis found the average color of places around…
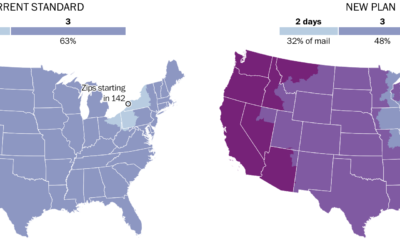
Mail slowdown
Postmaster General Louis DeJoy proposed new standards for first-class mail, which would slow…
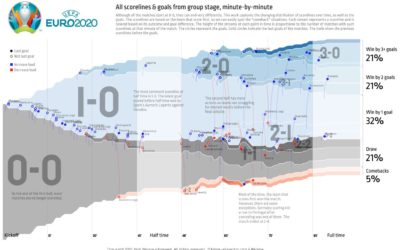
All the matches from Euro 2020 in one chart
To see all the matches from the group stage of Euro 2020 in…
How the ultrarich use a Roth IRA to get more rich
ProPublica continues their analysis of an anonymous IRS tax records dump. In their…
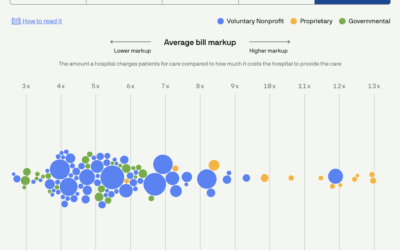
Scoring hospitals by billing quality
Using data collected by Johns Hopkins University, Michelle McGhee and Will Chase for…
Delaying motherhood
The New York Times mapped birth rates, which are down almost everywhere, especially…
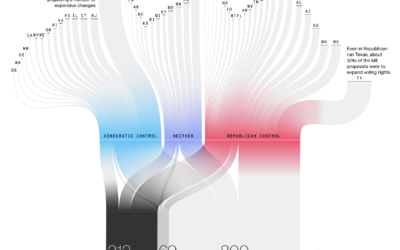
Passing restrictive voting bills
Bloomberg used a Sankey diagram to show the path of over a thousand…

