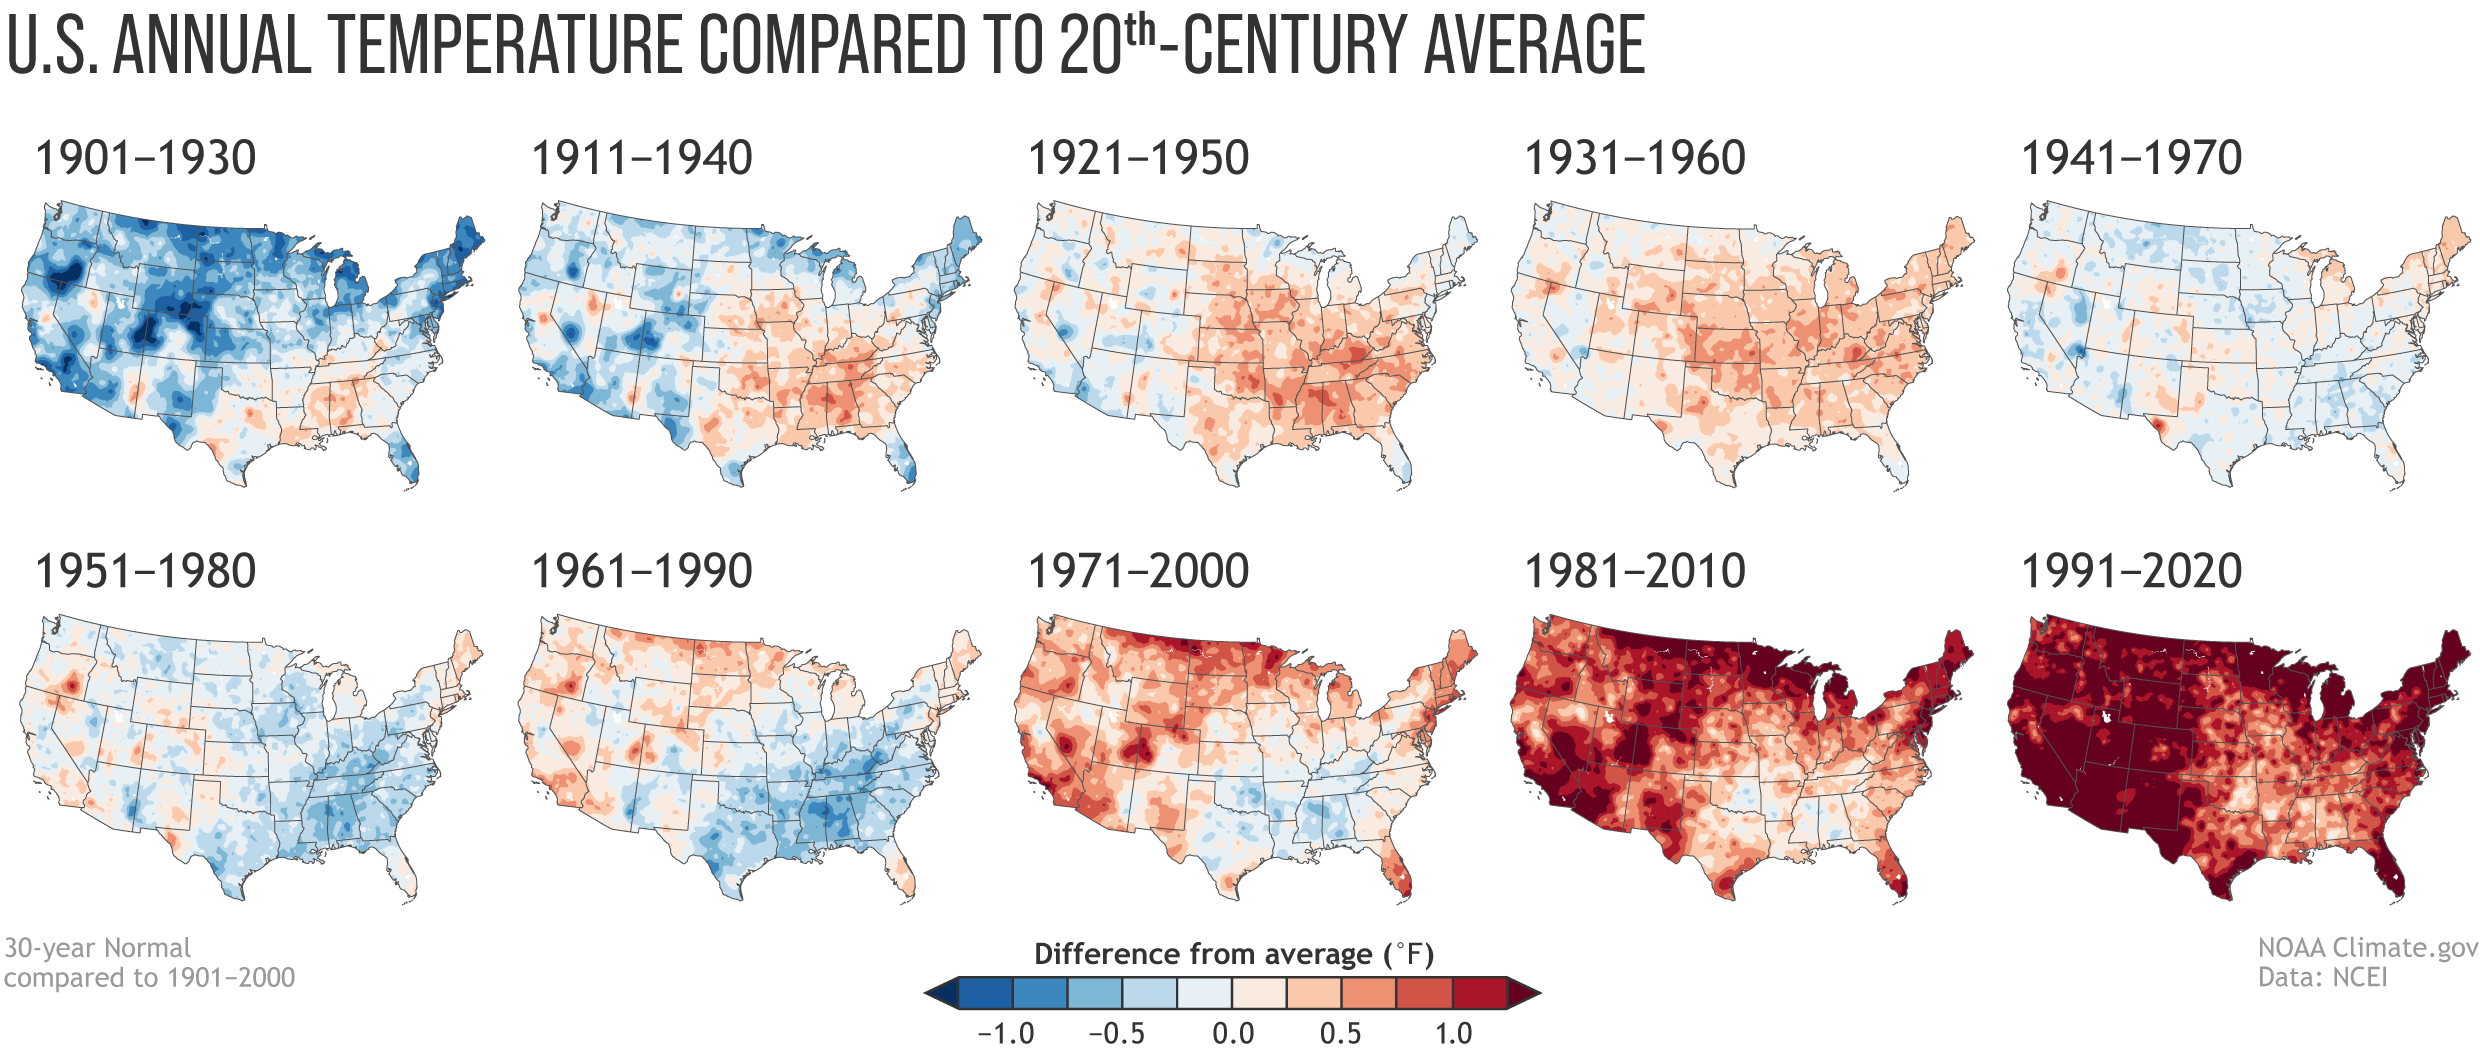
Climate normals mapped over time
May 13, 2021

Every decade the National Oceanic and Atmospheric Administration releases climate normals to provide a baseline to compare current weather against. NOAA just released the estimates for 1991 to 2020. As you might expect, and shown in the maps above, it’s getting hotter.

Become a member. Support an independent site. Make great charts.

See What You Get

Learn to Visualize Data See All →

How I Made That: Animated Square Pie Chart

Also known as waffle charts. Using animated transitions between values, you can allow for comparisons between categories.

How to Make Venn Diagrams in R

The usually abstract, qualitative and sometimes quantitative chart type shows relationships. You can make them in R, if you must.

Making an Interactive Map with Category Filters

Let readers focus on the regions they care about to make their own comparisons and conclusions.

How to Make a Smoother Animated Growth Map in R

Show change over time and geography with smooth transitions.

Favorites

Data, R, and a 3-D Printer

We almost always look at data through a screen. It’s quick and good for exploration. So is there value in making data physical? I played around with a 3-D printer to find out.

Shifting Incomes for American Jobs

For various occupations, the difference between the person who makes the most and the one who makes the least can be significant.

Graphical perception – learn the fundamentals first

Before you dive into the advanced stuff – like just about everything in your life – you have to learn the fundamentals before you know when you can break the rules.

Who We Spend Time with as We Get Older

In high school, we spend most of our days with friends and immediate family. But then we get jobs, start a family, retire, and there’s a shift in who we spend our days with.