Visualization
Showing the stories in data through statistics, design, aesthetics, and code.
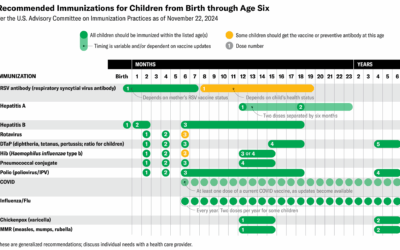
Table for science-backed vaccine recommendations
Jen Christiansen and Meghan Bartels provide a quick reference for Scientific American:
Kennedy’s…
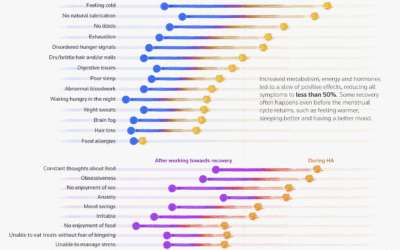
When a woman’s cycle stops
Many women lose their period while still of reproductive age. For Reuters, Daisy…
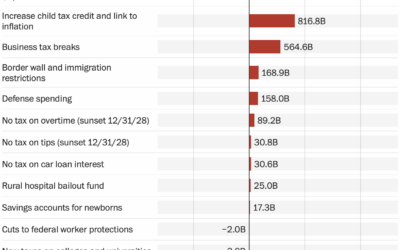
Overview of the GOP bill, a bar chart
The Washington Post starts with a bar chart to show the major changes…
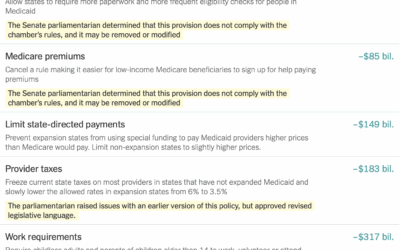
Cost and savings for each item in the GOP bill
NYT’s the Upshot has a running list of the items in the bill…
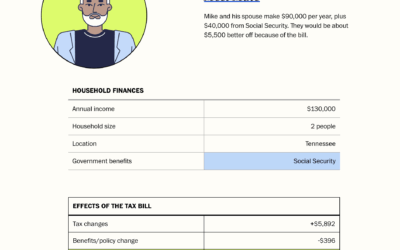
Effects of the Republican bill on your taxes
The tax bill, that seems to be on its way to passing, will…
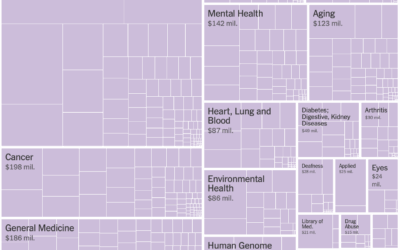
Harvard’s $2.6b of grants canceled by the government
For NYT’s the Upshot, Emily Badger, Aatish Bhatia, and Ethan Singer accounted for…
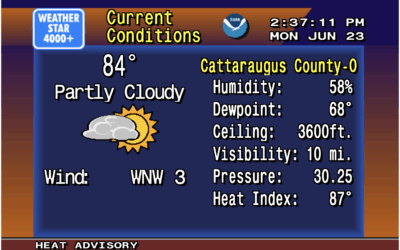
Weather displayed as vintage 1990s forecast on the Weather Channel
There was a time when you tuned in to the Weather Channel on…
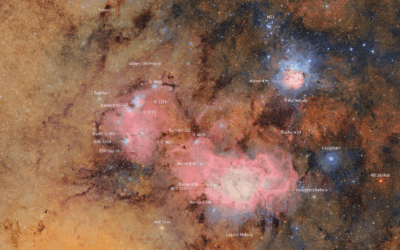
Rubin Observatory releases first imagery of the night sky at enormous scale
The Vera C. Rubin Observatory, jointly funded by the National Science Foundation and…

Depth of bunker-buster bombs
To show how deep bunker-buster bombs penetrate the ground, the New York…

Satellite imagery shows avoided nuclear reactors in Iran
Jonathan Tirone, reporting for Bloomberg:
Notably absent from the latest International Atomic Energy…
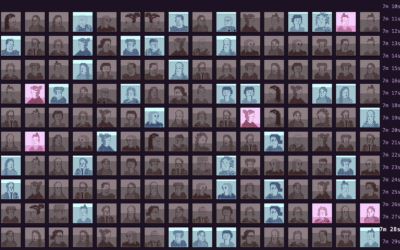
Feelings when strangers talk for 30 minutes
For the Pudding, Alvin Chang uses the CANDOR corpus to explore our feelings…
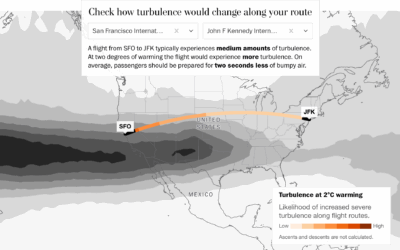
As temperatures rise, how much turbulence to expect on your flight
With temperatures rising, we must prepare for how everyday life could change, other…
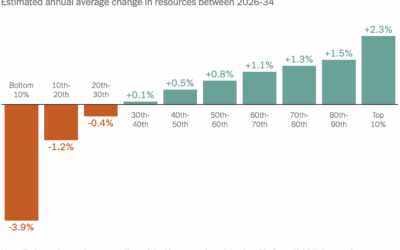
Republican bill’s effects on household income, by income group
The bill proposed by the current administration affects incomes of the poor and…
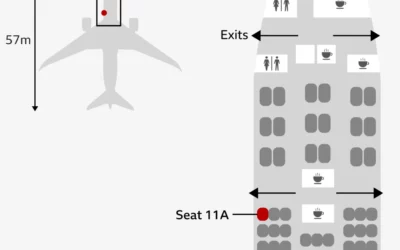
Seating chart for lone survivor in India plane crash
There was one survivor from Air India flight AI171. He sat in seat…
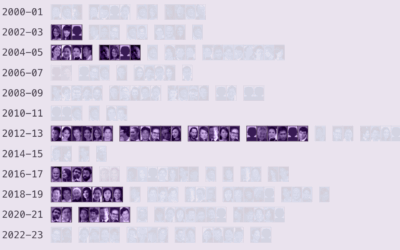
Asian misrepresentation in American films
For the Pudding, Dorothy Lu and Anna Li examine the match rate between…
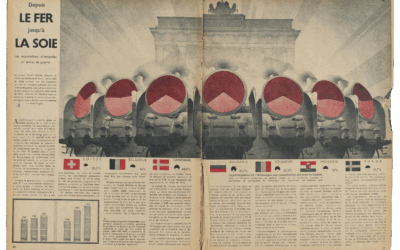
Nazi propaganda charts
RJ Andrews and Attila Bátorfy highlight information graphics from Signal, the Nazi propaganda…
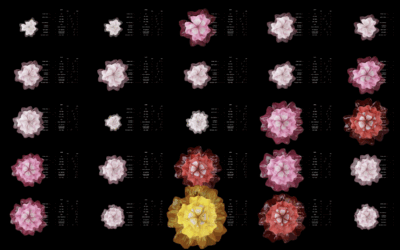
Flower blooms to visualize climate change
Annelie Berner used blooming flowers as a visual metaphor to show climate change.…
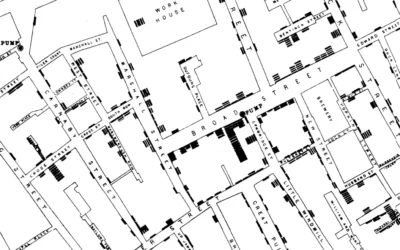
John Snow probably didn’t use that Broad Street map to reach his conclusions about cholera
Many visualization folks recognize the cholera map as a vital tool that John…